Which Sectors and Industries Purchase Transferable Tax Credits Most Often?
The final of a series of data-driven posts exploring how companies are participating in the transferable tax credit market.


Consumer cyclical companies – including construction companies and retailers – purchase transferable tax credits at the highest rate of any sector: 16 percent, or roughly five times the rate of technology companies.
Reunion analyzed over 6,000 public filings across approximately 1,400 of the largest U.S. public companies to determine which industries are most actively purchasing transferable clean energy tax credits under IRC Section 6418. ASU 2023-09, a new accounting standard in effect for fiscal years beginning after December 15, 2024, requires more granular tax disclosures by public companies and makes credit purchases easier to verify.
How Do Tax Credit Purchase Rates Vary by Sector?
The following table shows the share of companies in each GICS sector that have been verified as purchasers of transferable tax credits, based on SEC filings since January 2025.
Source: Reunion analysis of SEC filings (10-K, 10-Q, 20-F, 40-F) filed since January 1, 2025. Sectors based on Yahoo Finance GICS classification.
Consumer Cyclical Leads at 16%
The Consumer Cyclical sector – which includes retail, construction, restaurants, and lodging -- has the highest purchase rate at 16%. Within this sector, residential construction companies purchase at 33%, specialty retailers at 24%, and restaurants at 18%.
Factors leading construction companies toward greater tax credit purchases include predictable federal tax liabilities, and limited availability of tax strategies such as R&D credits and international structuring opportunities. Retail faces similar structural characteristics – often more acutely. Retail R&D intensity is minimal relative to technology or pharma, and retailers face large and recurring domestic tax expenses.
For many companies in these industries, transferable credits are the first meaningful new federal tax reduction tool in decades.
Financial Services Is the Second-Largest Buyer Sector
Financial services companies purchase at 12%, driven by banks, insurers, and asset managers. Many of these institutions have prior experience with tax-equity investing, making transferable credits a natural adjacent strategy. Regional banks are also active, purchasing at 13%.
Technology Purchases at Just 3%
Despite housing some of the largest taxpayers in the S&P Composite, the technology sector purchases at just 3% – roughly one-fifth the rate of Consumer Cyclical. Large technology companies typically already leverage substantial R&D credits, stock-based compensation deductions, and international tax planning structures that reduce their effective tax rates well below the statutory federal rate.
SIC Industry Classification Tells a Similar Story
Grouping by SIC division rather than GICS sector produces a similar picture:
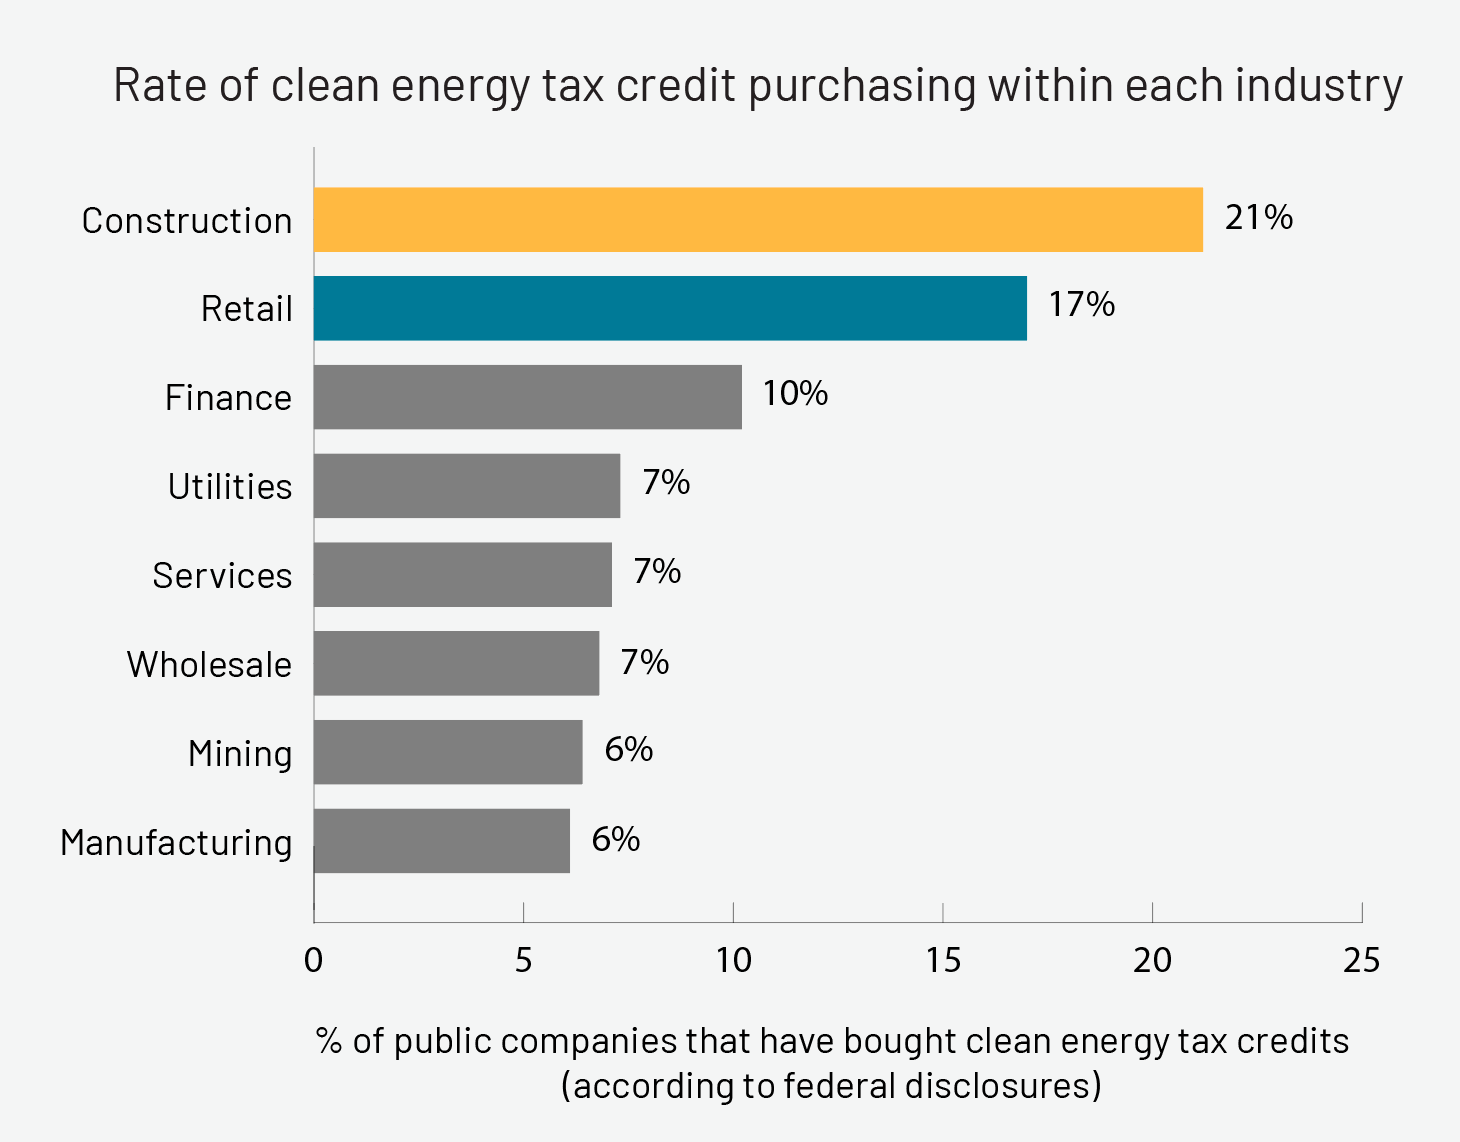
Key Takeaway
The strongest predictor of tax credit purchasing is not company size or profitability – but rather the combination of a meaningful federal tax liability and limited access to alternative tax reduction strategies. Sectors where these two conditions converge (e.g. consumer cyclical, financial services, industrials) show purchase rates significantly higher than sectors where companies already have robust tax optimization tools.
For the first post in this series that explores the tax credit purchaser landscape by analyzing data from publicly available filings, click here.
Reunion maintains a database of public companies that have disclosed transferable tax credit purchases, available to entities buying or selling credits, and provides exclusive access to the underlying SEC data to existing buy-side and sell-side clients of Reunion. Reach out to your Reunion contact for access.
Data Notes
Analysis Period: February-March 2026
Universe: ~1,400 largest U.S. public companies
Filings Reviewed: 10-K, 10-Q, 20-F, 40-F filed since January 1, 2025
Sectors: Based on Yahoo Finance GICS classification
Methodology:
- Credit Classification: Many filings reference transferable credits without specifying type. These are classified as clean energy credits since transferability is generally tied to Section 6418.
- Sample Composition: Of approximately 1,400 companies, roughly 1,000 had filed both 2024 and 2025 reports during the analysis window. The remainder had not yet filed 2025 reports or had 2024 filings published before data collection began.
- Data Quality: An AI-assisted process was used to scan filings. All identified purchasing activity was then human-verified at the company level.