What Is Tax Credit Market, Its Size and How It works
Explore the projected $45B-$50B growth of the transferable tax credit market size, with monetization strategies like transferability, tax equity and direct pay.


Executive summary
Over the past 12 months, the rate of growth in the transferable tax credit market has continually surprised industry observers and participants.
Reunion has analyzed how large the transferable tax credit market could be on an annual basis, as well as the size of various monetization strategies – tax equity, direct pay, retention, and transfer.
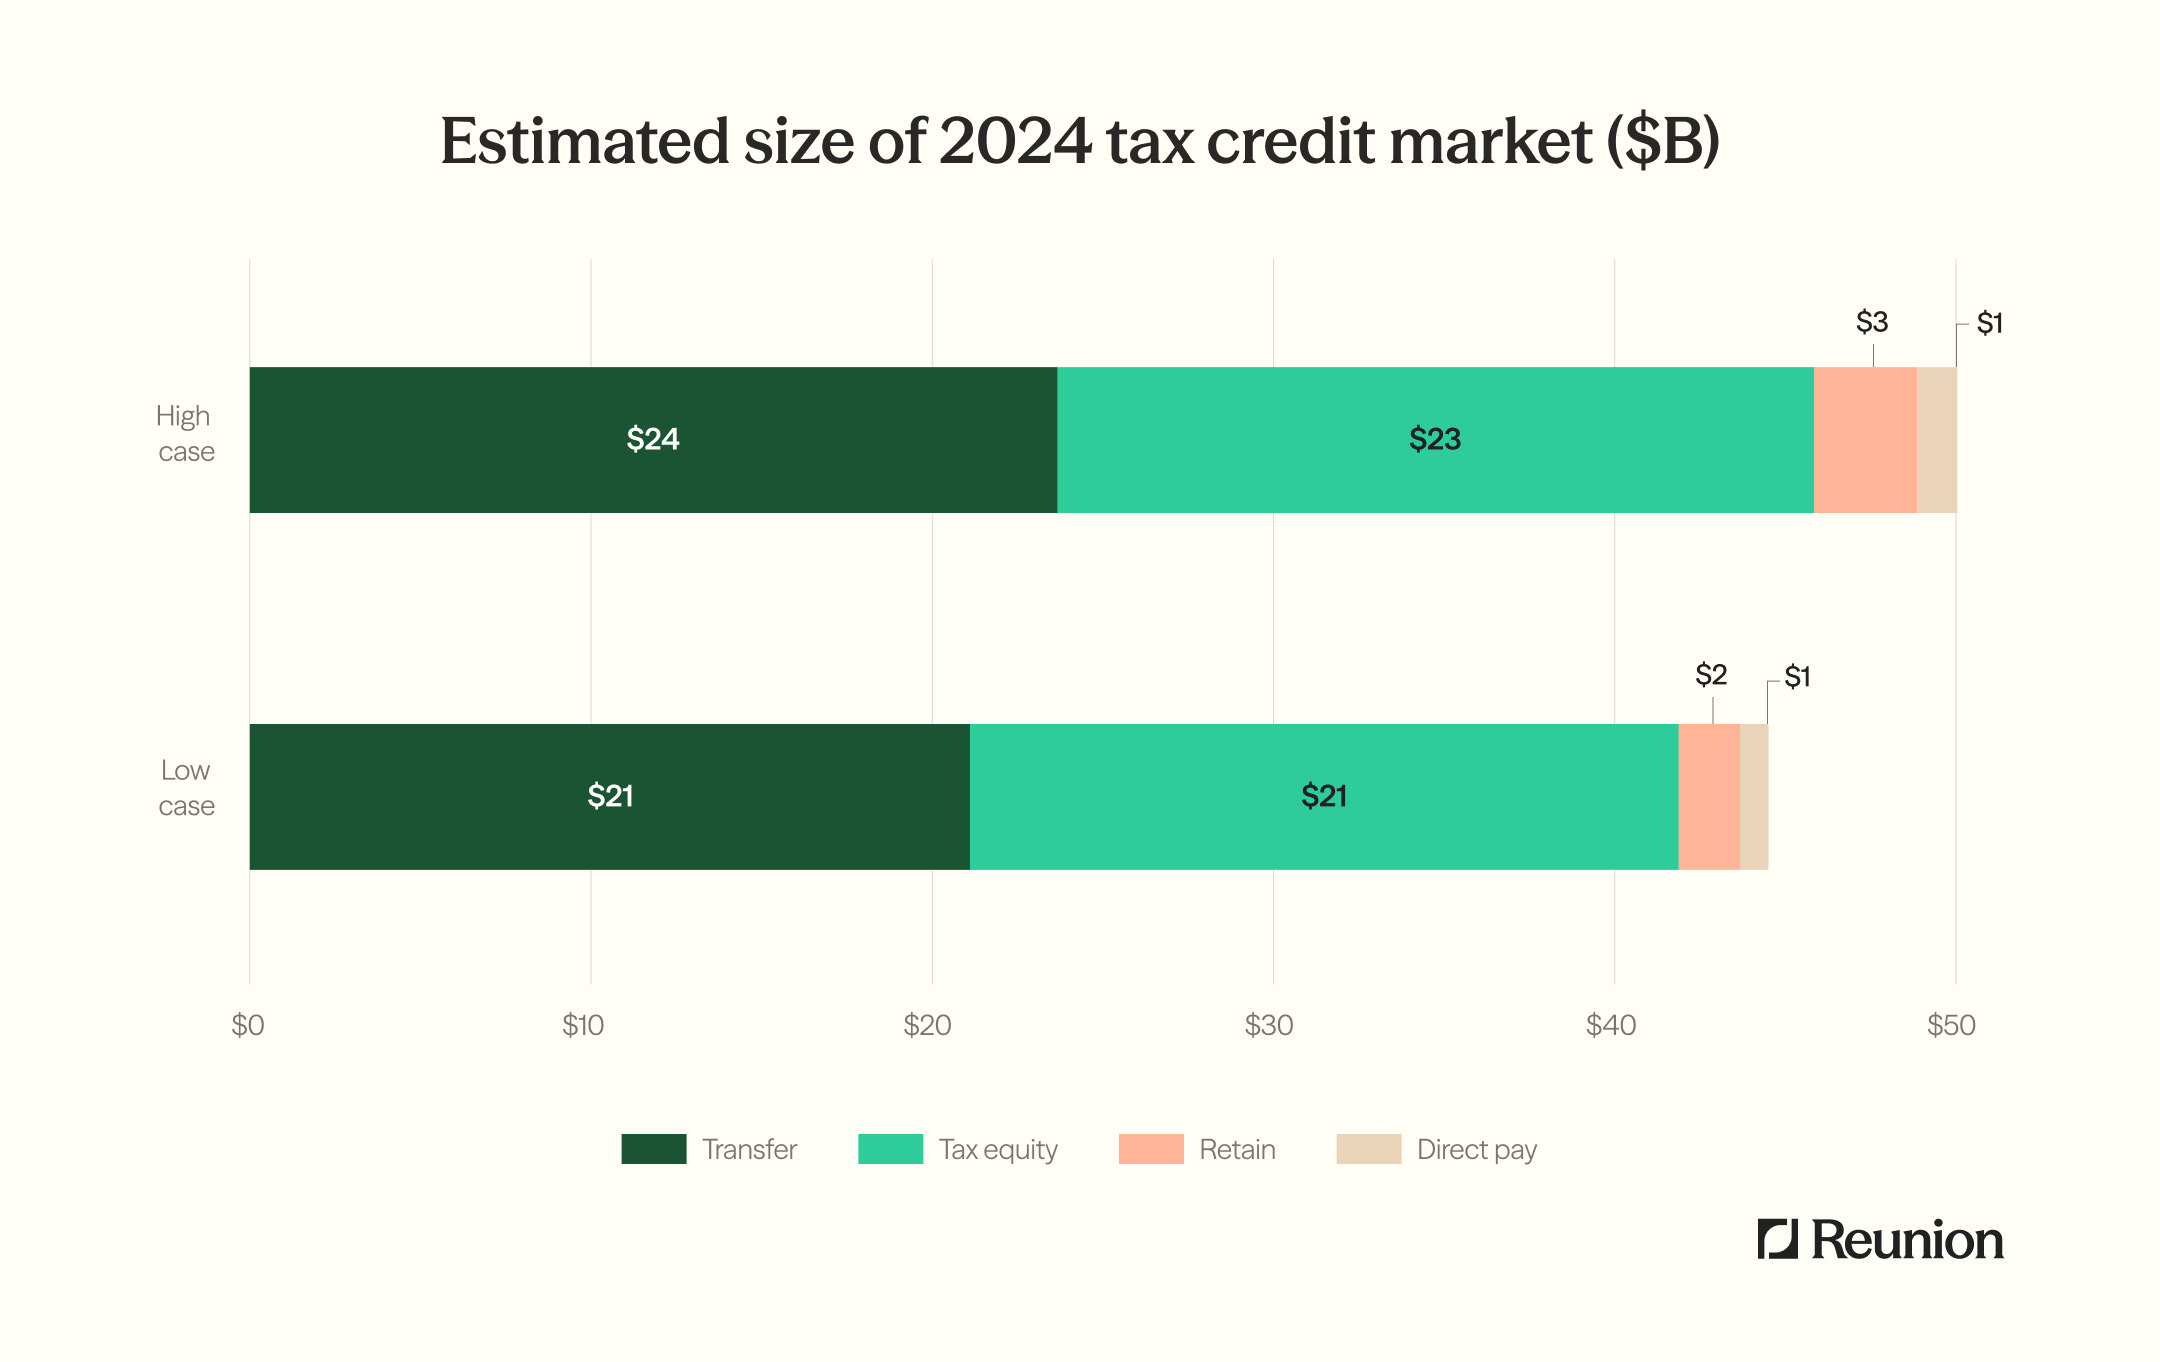
We estimate that the total size of the transferable tax credit market in 2024 will range from $45B to $50B, which will be broken into four key monetization strategies:
- Transfer: $21B to $24B
- Tax equity: $21B to $23B
- Retain: $1.8B to $2.4B
- Direct pay: $0.8B to $1.0B
Over a nine-year period, Reunion estimates the total volume of clean energy tax credits to steadily climb, surpassing $90B in 2030.
Of the annual total, we expect approximately 50% to 60% to be monetized through transferability.
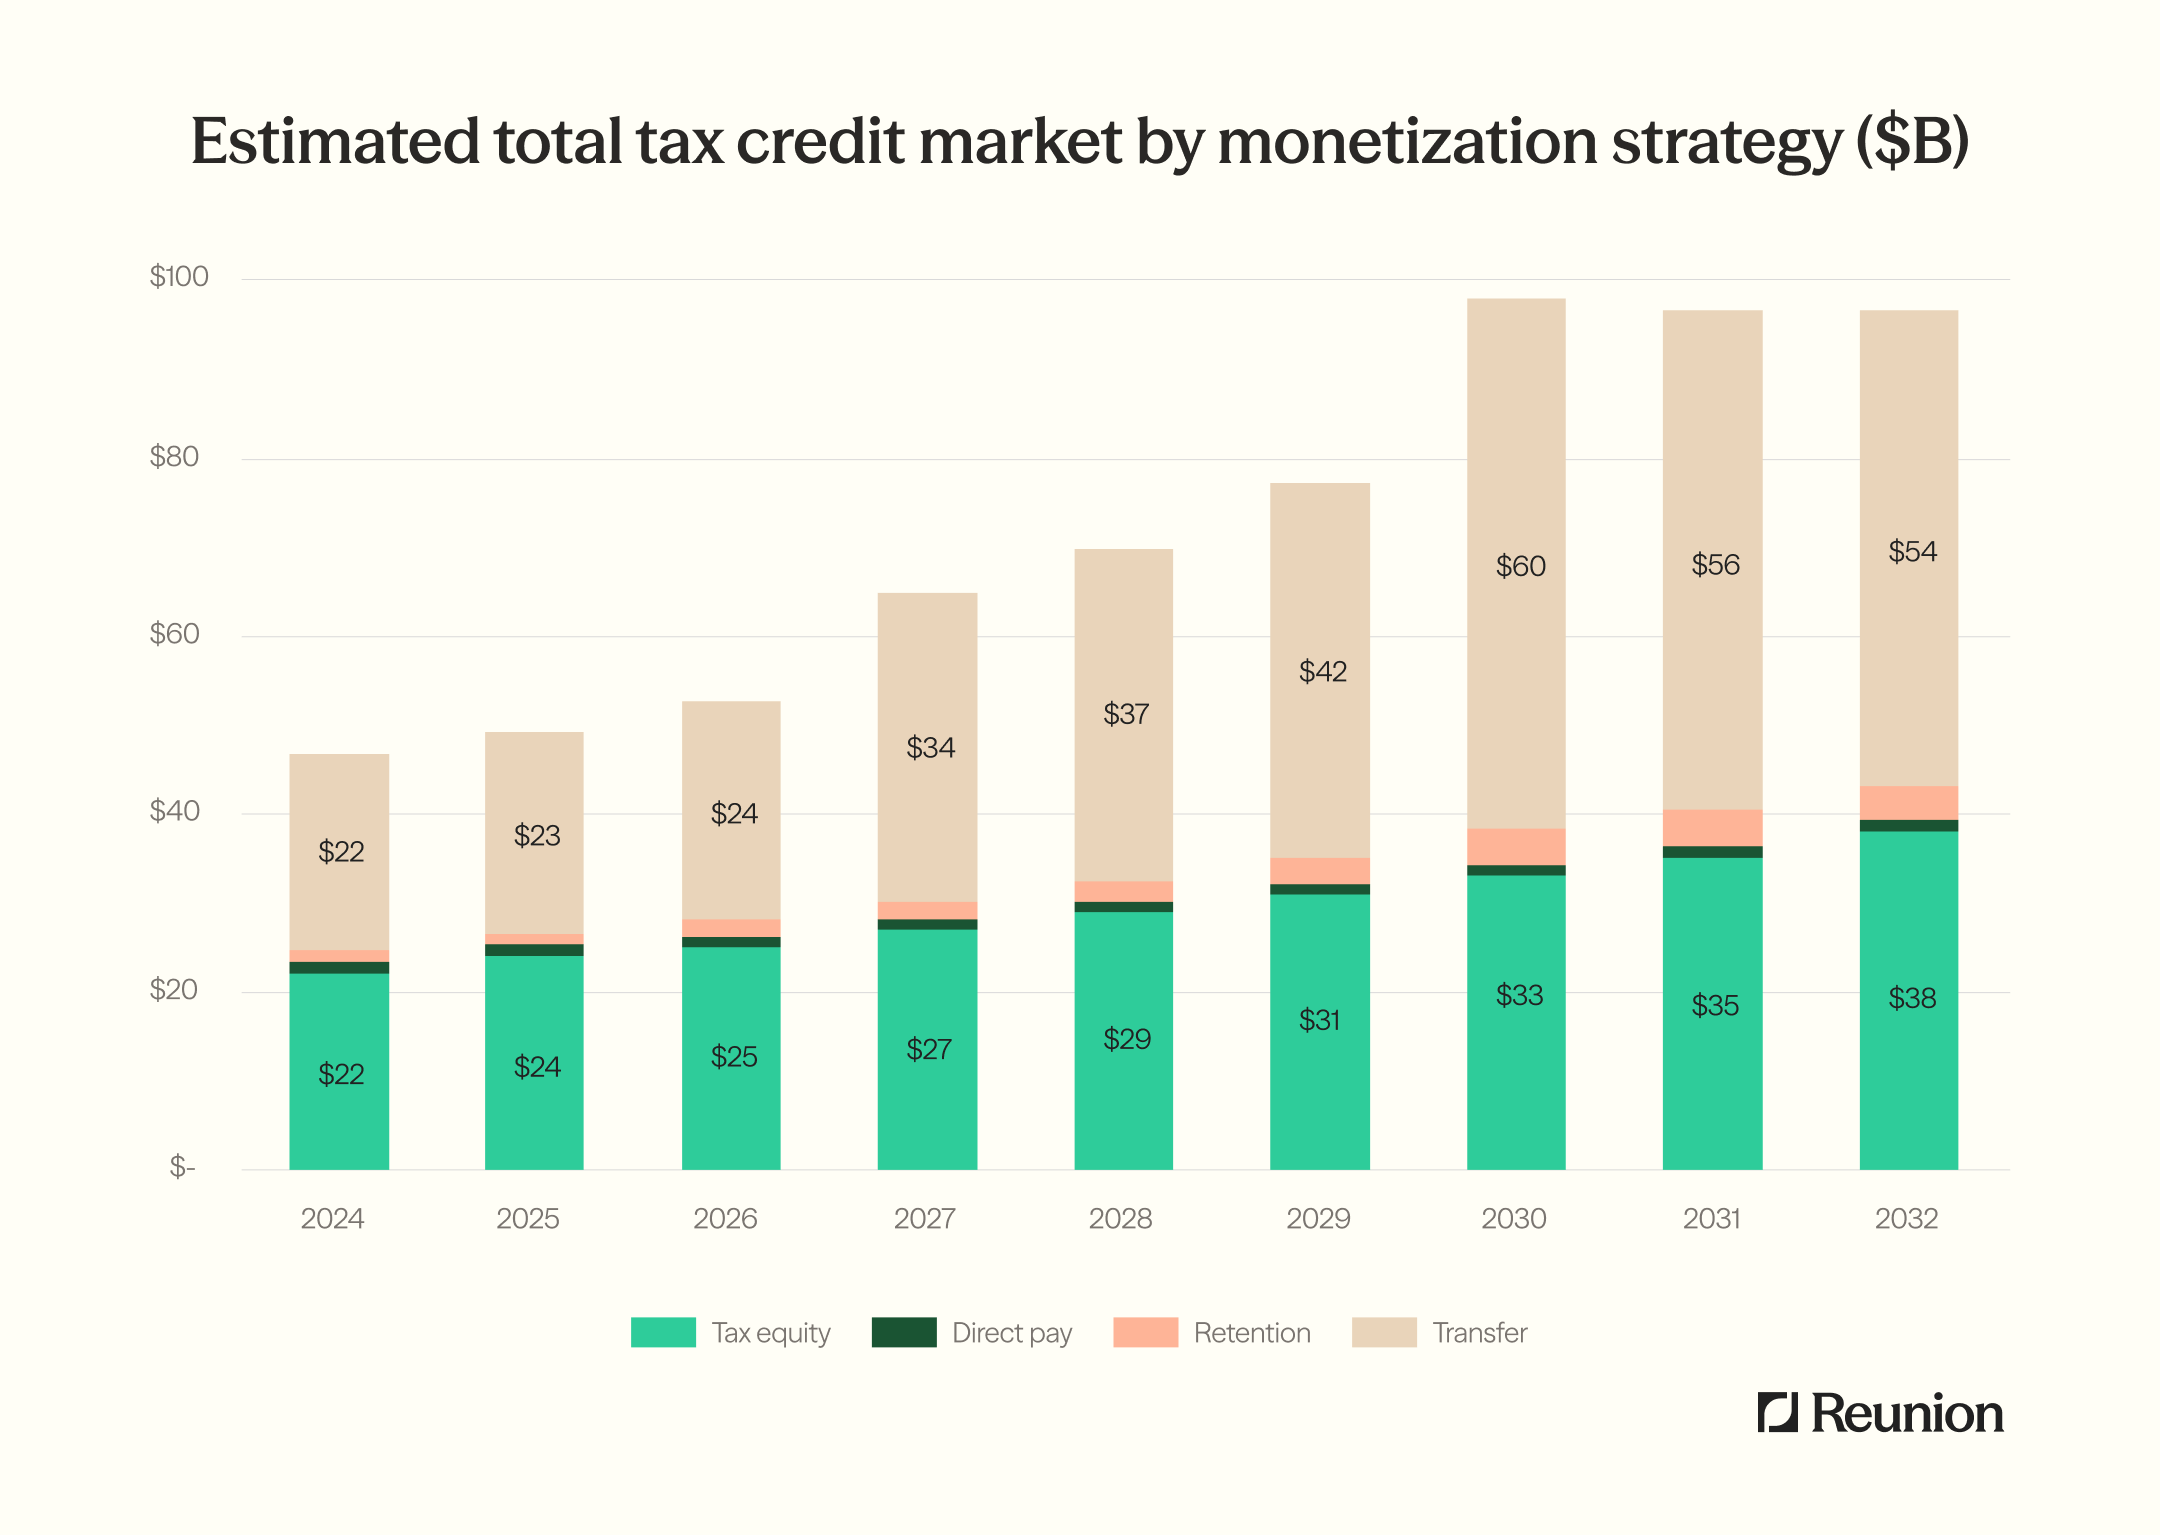
We ran our estimate through 2032 for two reasons. Under the §45X credit, manufactured components are subject to a four-year phase-down beginning in 2030 (75%, 50%, 25%, 0%). Therefore, manufactured components will no longer be eligible for the §45X after 2032. Also, 2032 is the first potential "applicable year" for the four-year phase-out of the §45Y PTC and §48E ITC.
Jump to a section
- Total transfer market: How many clean energy tax credits will be transfer in 2024?
- Tax equity: How many clean energy tax credits that are eligible for transferability will be monetized through traditional tax equity in 2024?
- Direct pay: How many clean energy tax credits that are eligible for transferability will be monetized through direct pay in 2024?
- Retain: How many clean energy tax credits that are eligible for transferability will be monetized directly by the developer, manufacturer, or refiner in 2024?
- Transfer: How many clean energy tax credits will be transferred in 2024?
- Stranded: How many clean energy tax credits will not be monetized in 2024?
- Looking ahead: How many clean energy tax credits will be eligible for transfer through 2032? Of these, how many will be transferred?
Total Transfer Market: $45B - $50B
How many clean energy tax credits will be eligible for transfer in 2024?
To estimate the total size of the market for transferable tax credits in 2024, we reviewed several existing estimates by industry observers:
- Congressional Budget Office
- Credit Suisse
- Evercore ISI
- Goldman Sachs
- University of Pennsylvania, Penn Wharton Budget Model
Our analysis identified two key trends:
- A significant increase in estimates following the passage of the IRA: Before August 2022, estimates of the volume of tax credits that would be generated following the passage of the IRA were clustered below $20B. After the IRA became law, estimates markedly increased
- Clustering between $45B and $50B: More recent estimates have fallen between $45B and $50B
$19B | University of Pennsylvania, Penn Wharton Budget Model (July 2022)
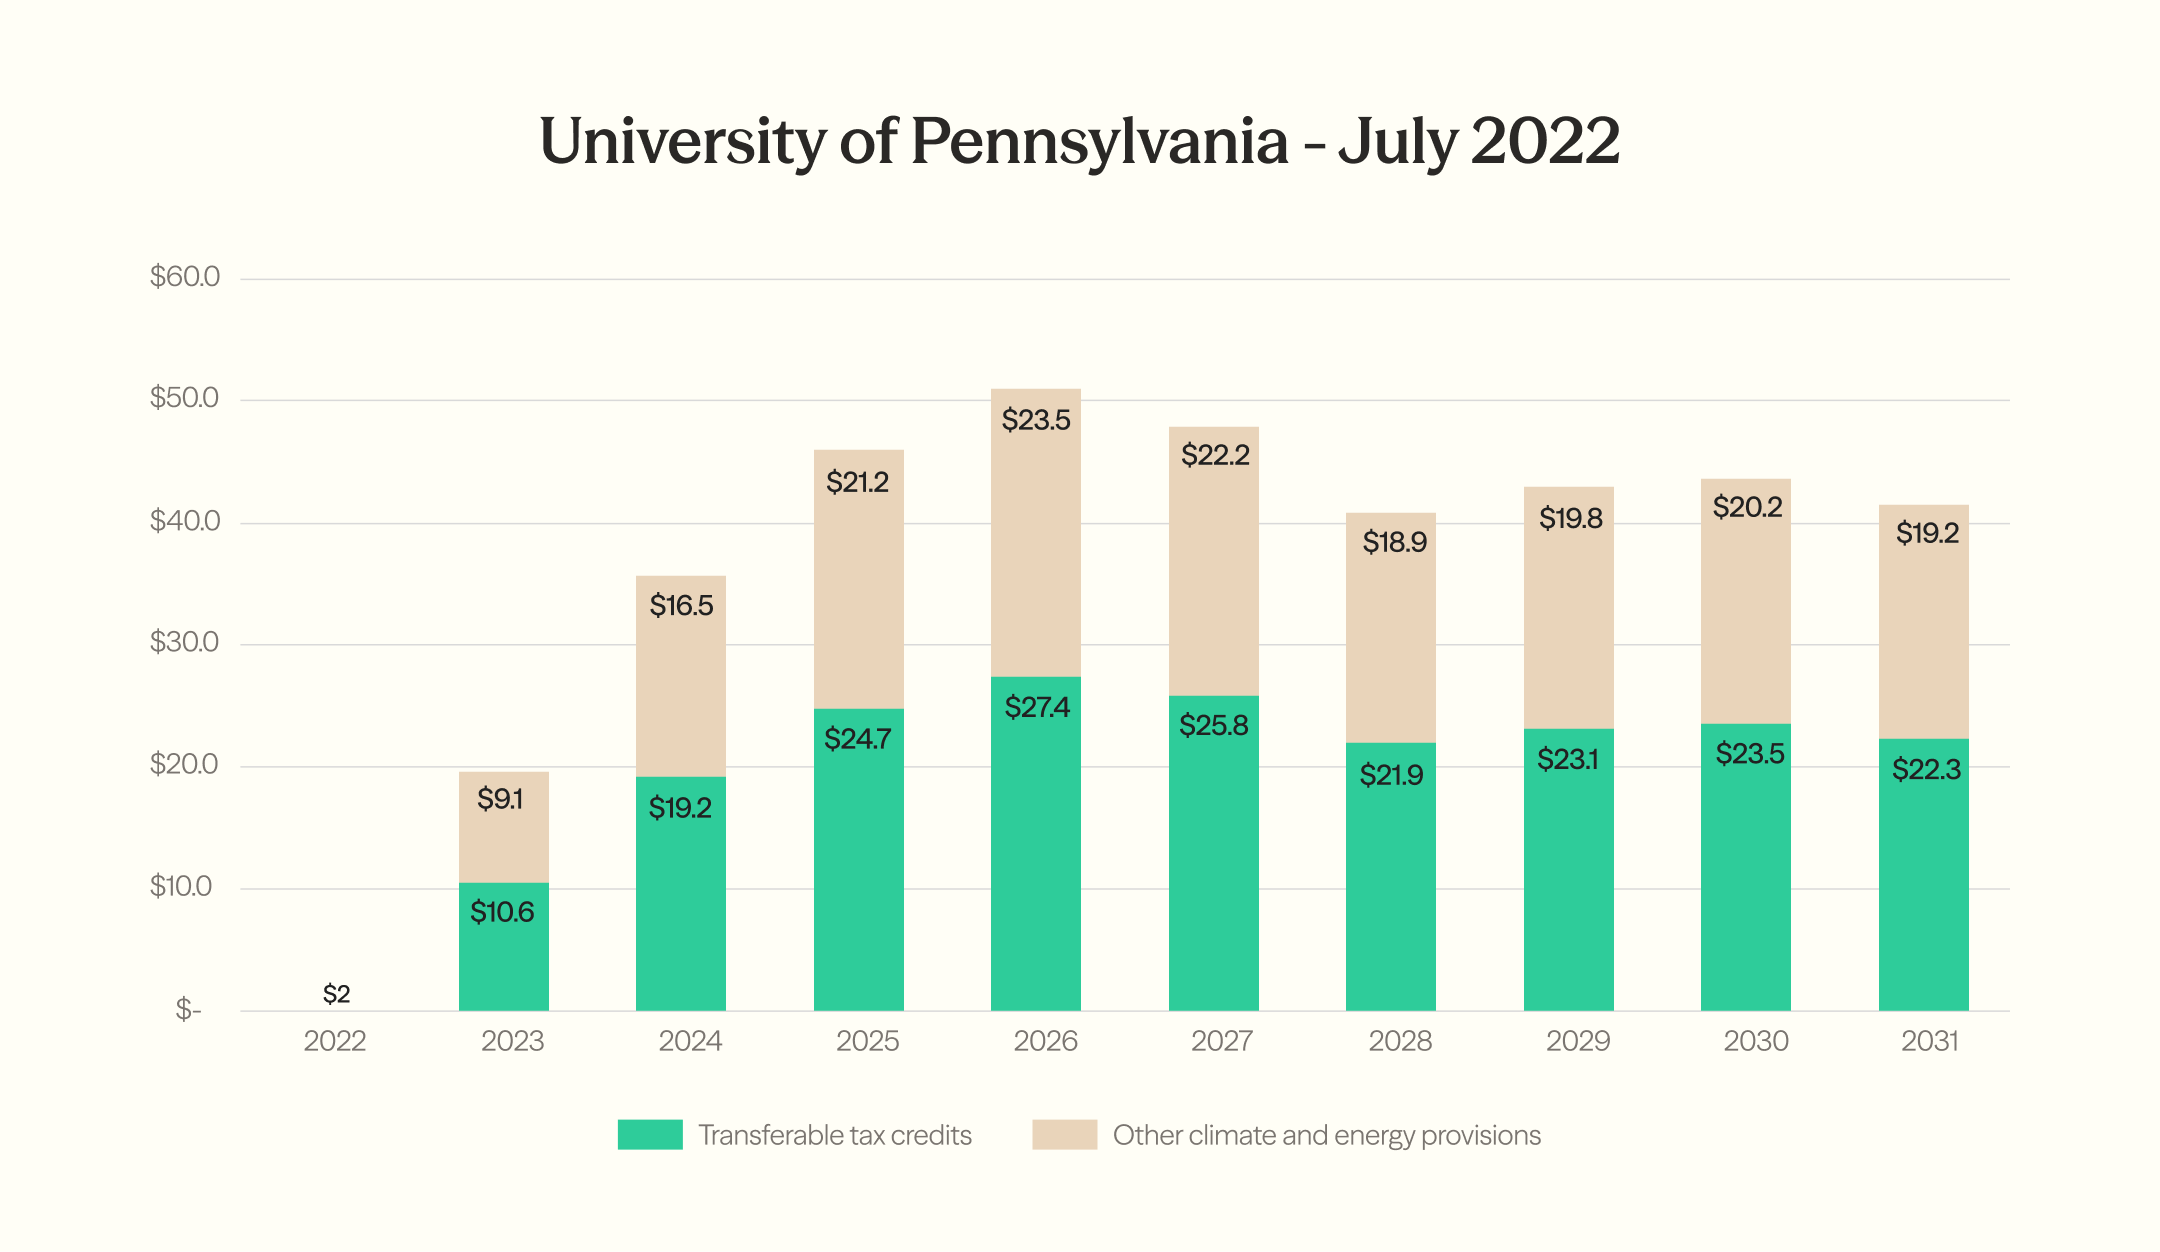
Shortly before the passage of the IRA, the University of Pennsylvania's Penn Wharton Budget Model (PWBM) provided a preliminary estimate of the budgetary effects of the legislation from 2022 through 2031.
The report pegged the ten-year cost of the IRA's "climate and energy" provisions at $369B and the 2024 cost at $35.7B. Importantly, PWBM's climate and energy bucket includes several sets of provisions:
- Tax rebates and credits to lower energy costs for households
- Tax credits, research, loans, and grants to increase domestic manufacturing capacity for wind turbines, solar panels, batteries, and other essential components of clean energy production and storage
- Tax credits to reduce carbon emissions
- Programs to reduce the environmental impact of agriculture
- A new fee on methane emissions
To isolate transferable tax credits, we can pull percentages for the various climate and energy provisions from an updated PWBM analysis (which we'll discuss in further detail):
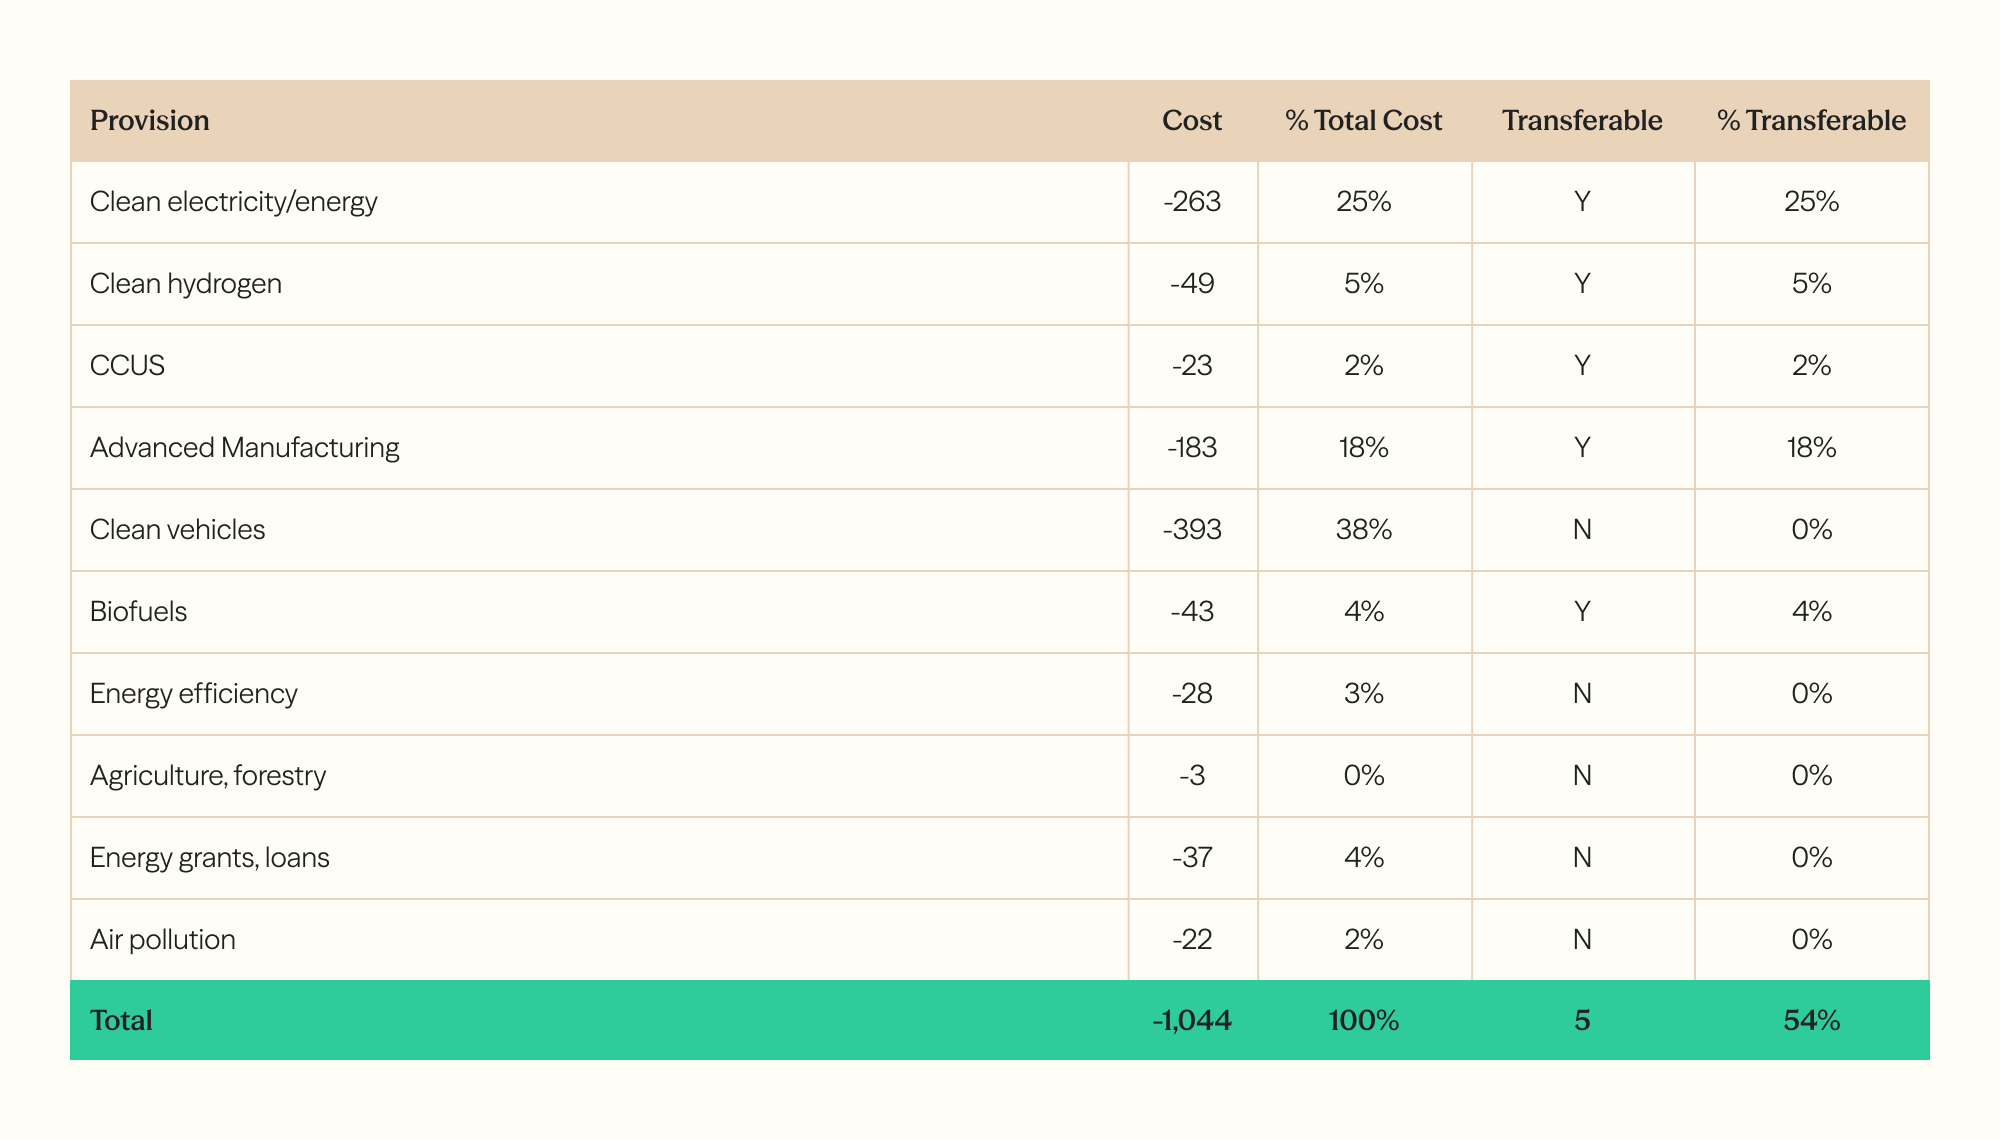
The resulting cost of transferable tax credits for 2024, then, is 54% of $35.7B, or $19.2B. If we apply the same percentage to the ten-year window, we arrive at a total cost of $198.3B for transferable tax credits.
$11B | Congressional Budget Office (August 2022)
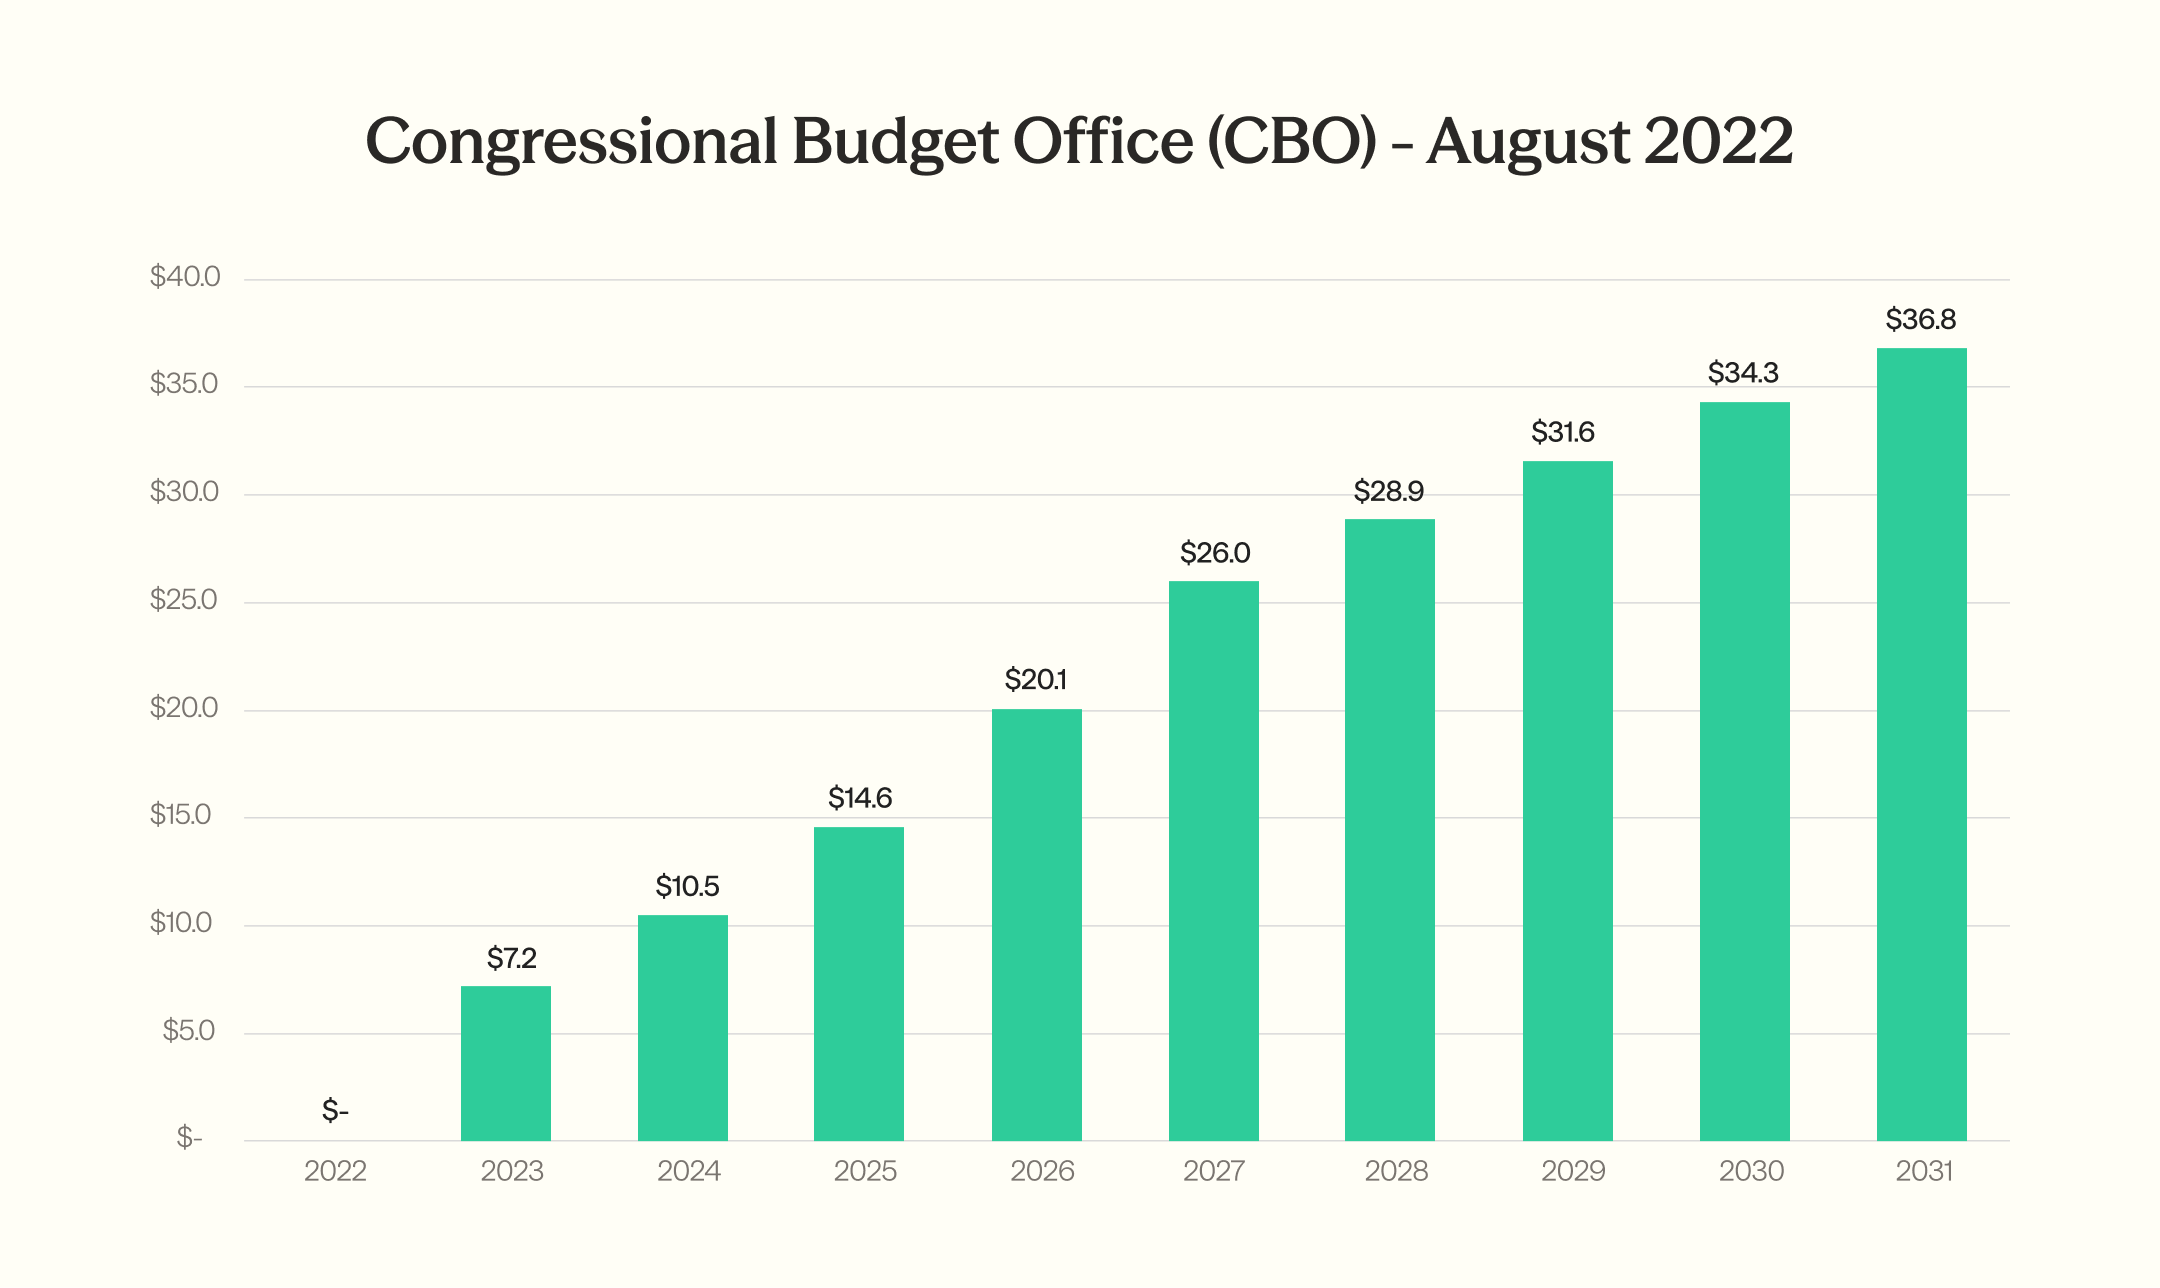
In an August 2022 report, the Congressional Budget Office (CBO) estimated the annualized budgetary effects of the Inflation Reduction Act (IRA) from 2022 to 2031. The report covers the entirety of the IRA, although transferable tax credits are broken out by their IRA section. IRA section 13101, for example, extends the §45 PTC.
The CBO estimates the ten-year budgetary impacts of transferable tax credits at $209.8B, $10.5B of which is in 2024.
$20B | University of Pennsylvania, Penn Wharton Budget Model (August 2022)
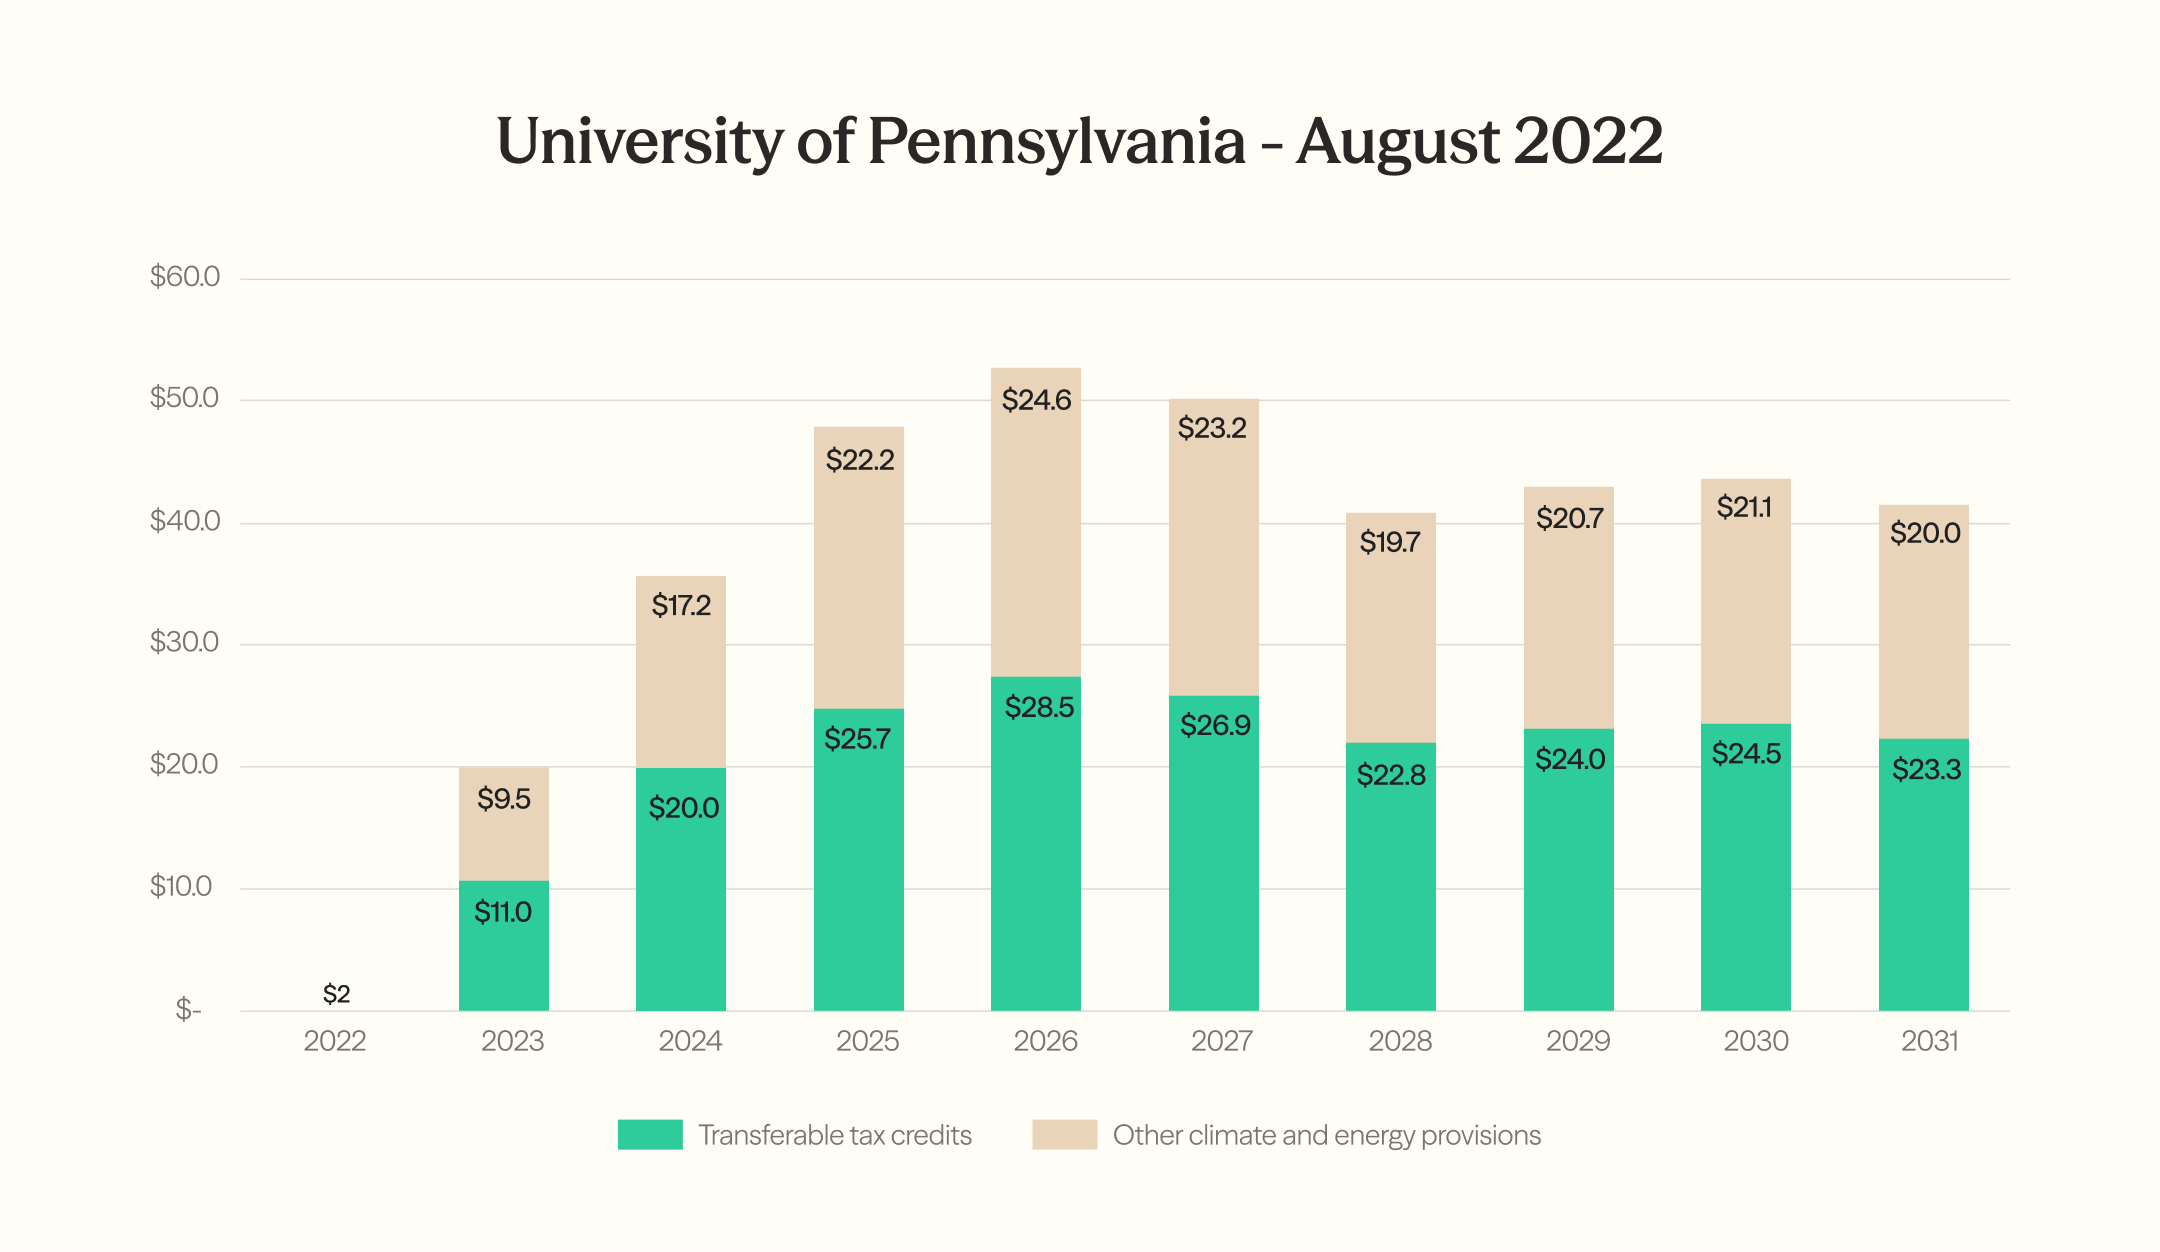
Once the Senate had passed the IRA, PWBM updated their July 2022 estimated budgetary effects of the IRA. The analysis, from August 2022, resulted in a slight uptick in cost across the board.
To estimate the size of the transferable tax credit market, we have to again scale the "climate and energy" provisions by 54%. The result is $20.0B for 2024 and $206.8B for 2022 through 2031.
$49B | Credit Suisse (November 2022)
Credit Suisse produced one of several analyses that argued initial estimates of the size of the IRA were low – perhaps as much as 3x too low:
"Climate spending will likely be significantly higher than the headline estimate. Roughly two-thirds of the baseline spending is allocated to provisions where the potential federal credit/incentive is uncapped. Our assessment of potential demand for clean electricity production tax credits (PTC) and investment tax credits (ITC), carbon capture, clean hydrogen, and renewable/battery manufacturing credits shows federal spending could reach >3x the cost estimates assigned for these key provisions. The advanced manufacturing provision alone could cost US$250 billion given the credits across solar, wind, and battery supply chains."
Credit Suisse estimated the ten-year cost of transferable tax credits at $528B and the 2024 cost at $49B.
.png)
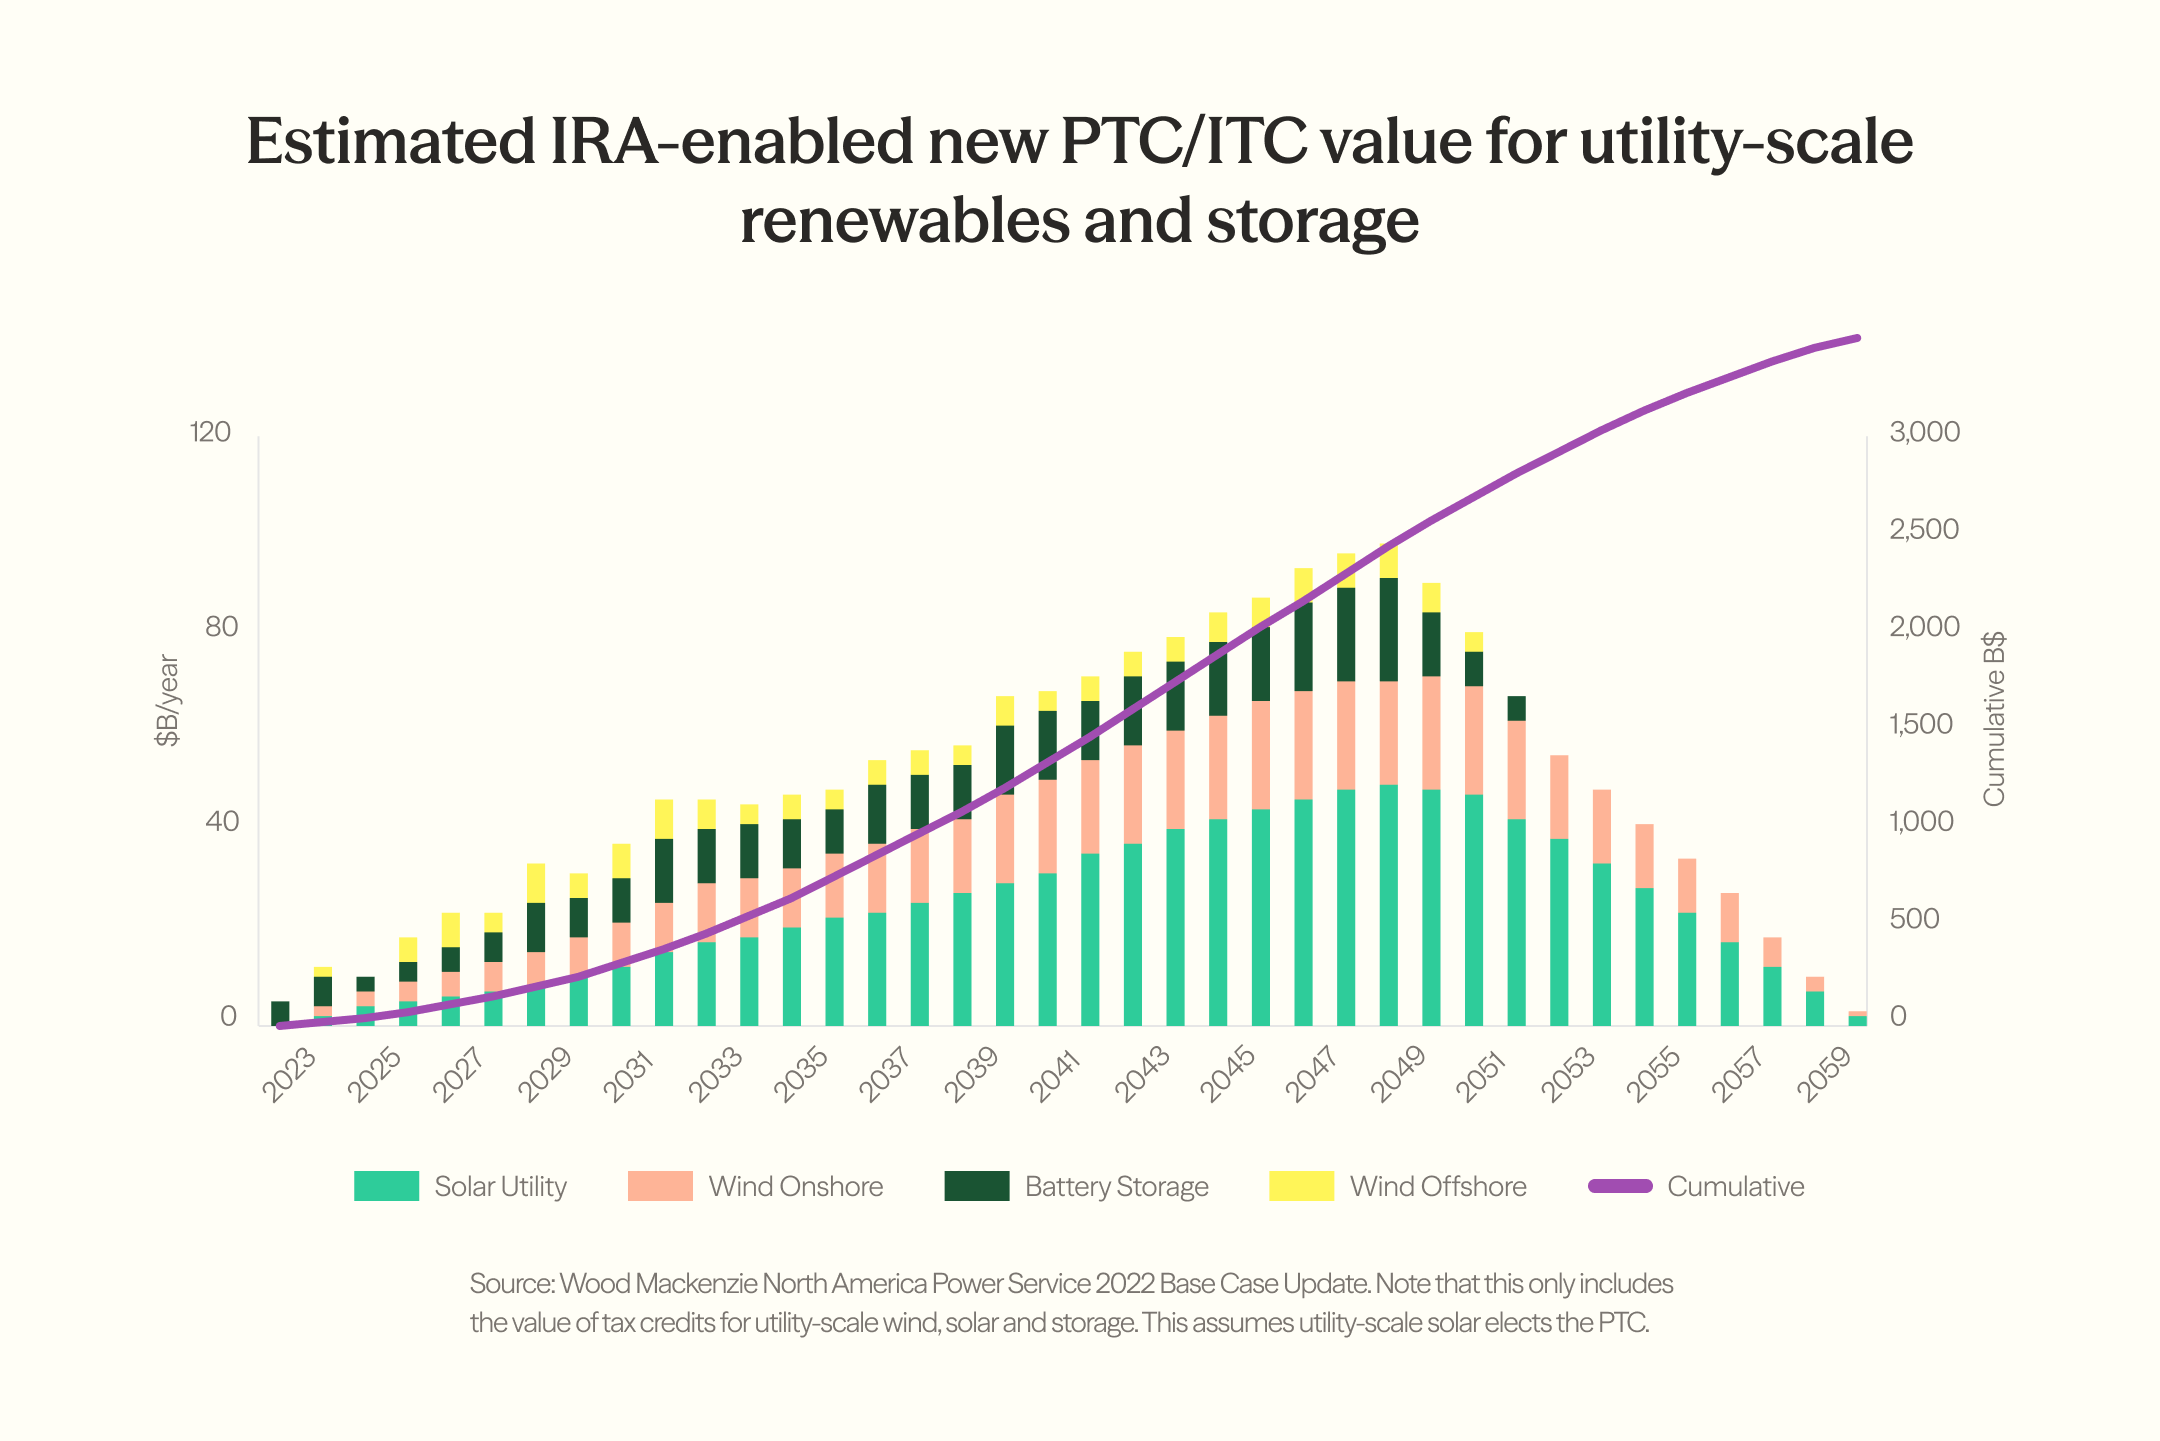
Wood Mackenzie similarly argued that the long-term cost of the IRA would greatly surpass initial estimates. However, Wood Mackenzie focused their analysis on ITCs and PTCs from solar, wind, and storage, so we omitted it from our review.
$33B | Goldman Sachs (March 2023)
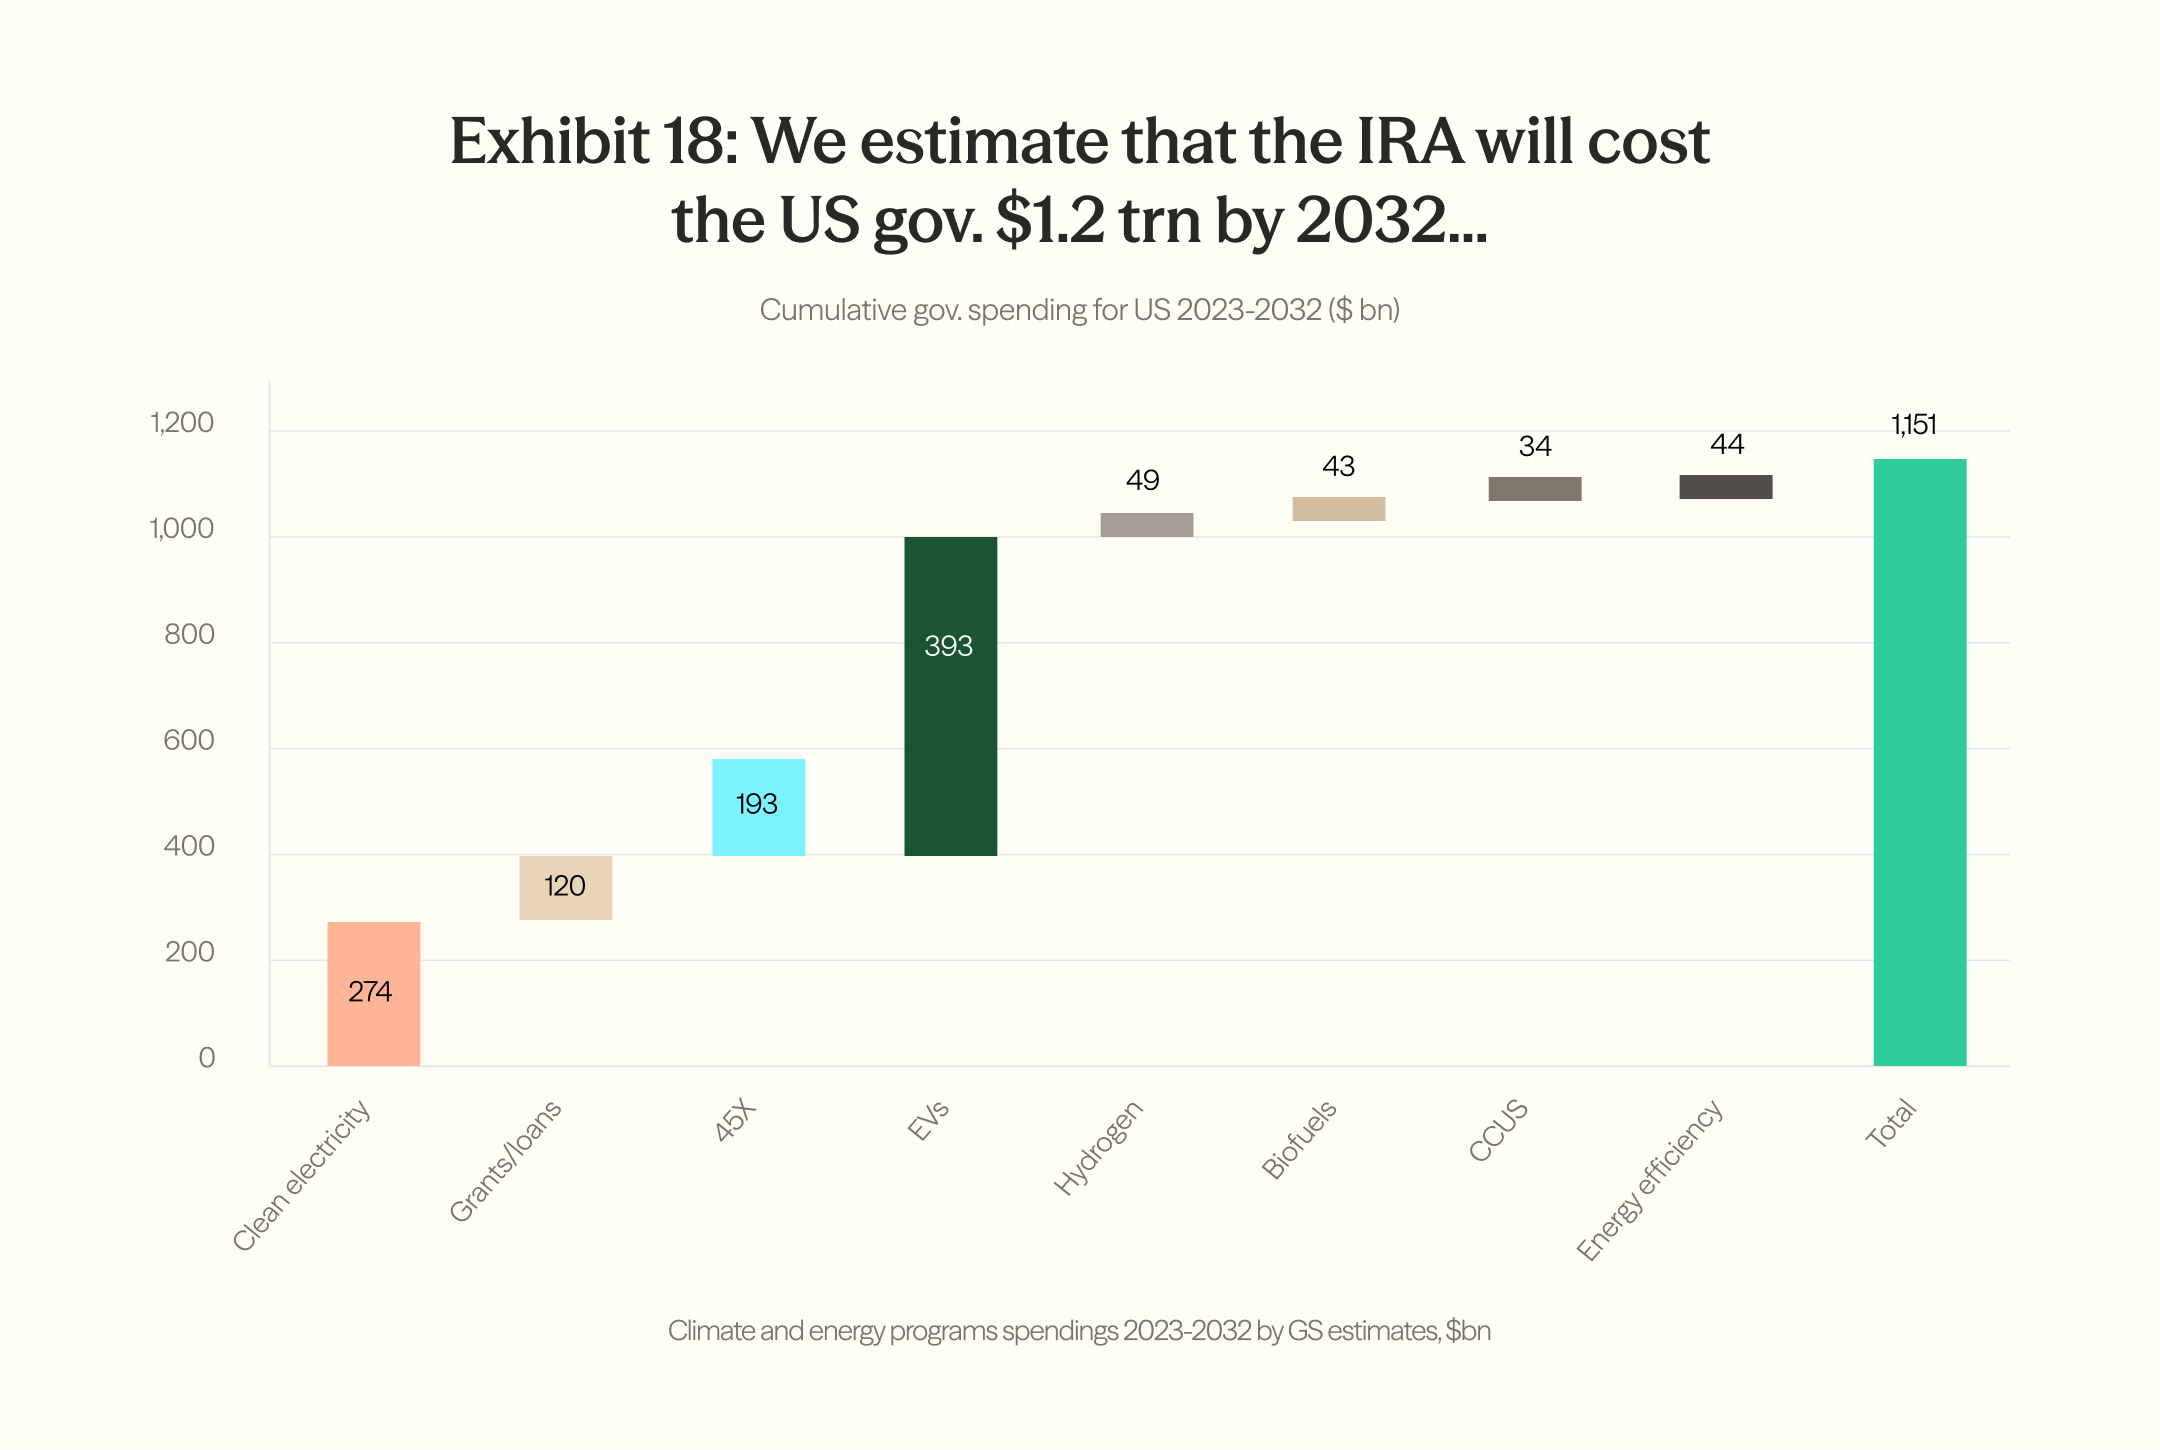
Goldman Sachs published an in-depth analysis of the costs and benefits of the IRA and, like Credit Suisse, concluded that early estimates were drastically low. Goldman Sachs estimated the IRA will cost the U.S. government $1.2T by 2032, with some incentives continuing into 2040.
To arrive at an estimate for the 2024 tax credit market, we should remove EVs and buildings from Goldman's estimate because these credits apply largely to individuals and will not be transferred. In exhibit 18, Goldman Sachs estimates that EV- and biofuel-related IRA programs will cost the U.S. government $393B and $43B, respectively.
If we apply this ratio – 90.1% EVs, 9.9% biofuels – to the combined 2024 estimate for “EVs and biofuels,” we remove approximately $9B of cost from 2024, resulting in an annual total of approximately $35B. Buildings further reduce this estimate by approximately $2B, resulting in an 2024 cost of approximately $33B.
Although Goldman Sachs did not publish a year-by-year estimate for transferable tax credits, they assembled a chart of annual IRA spending:
.png)
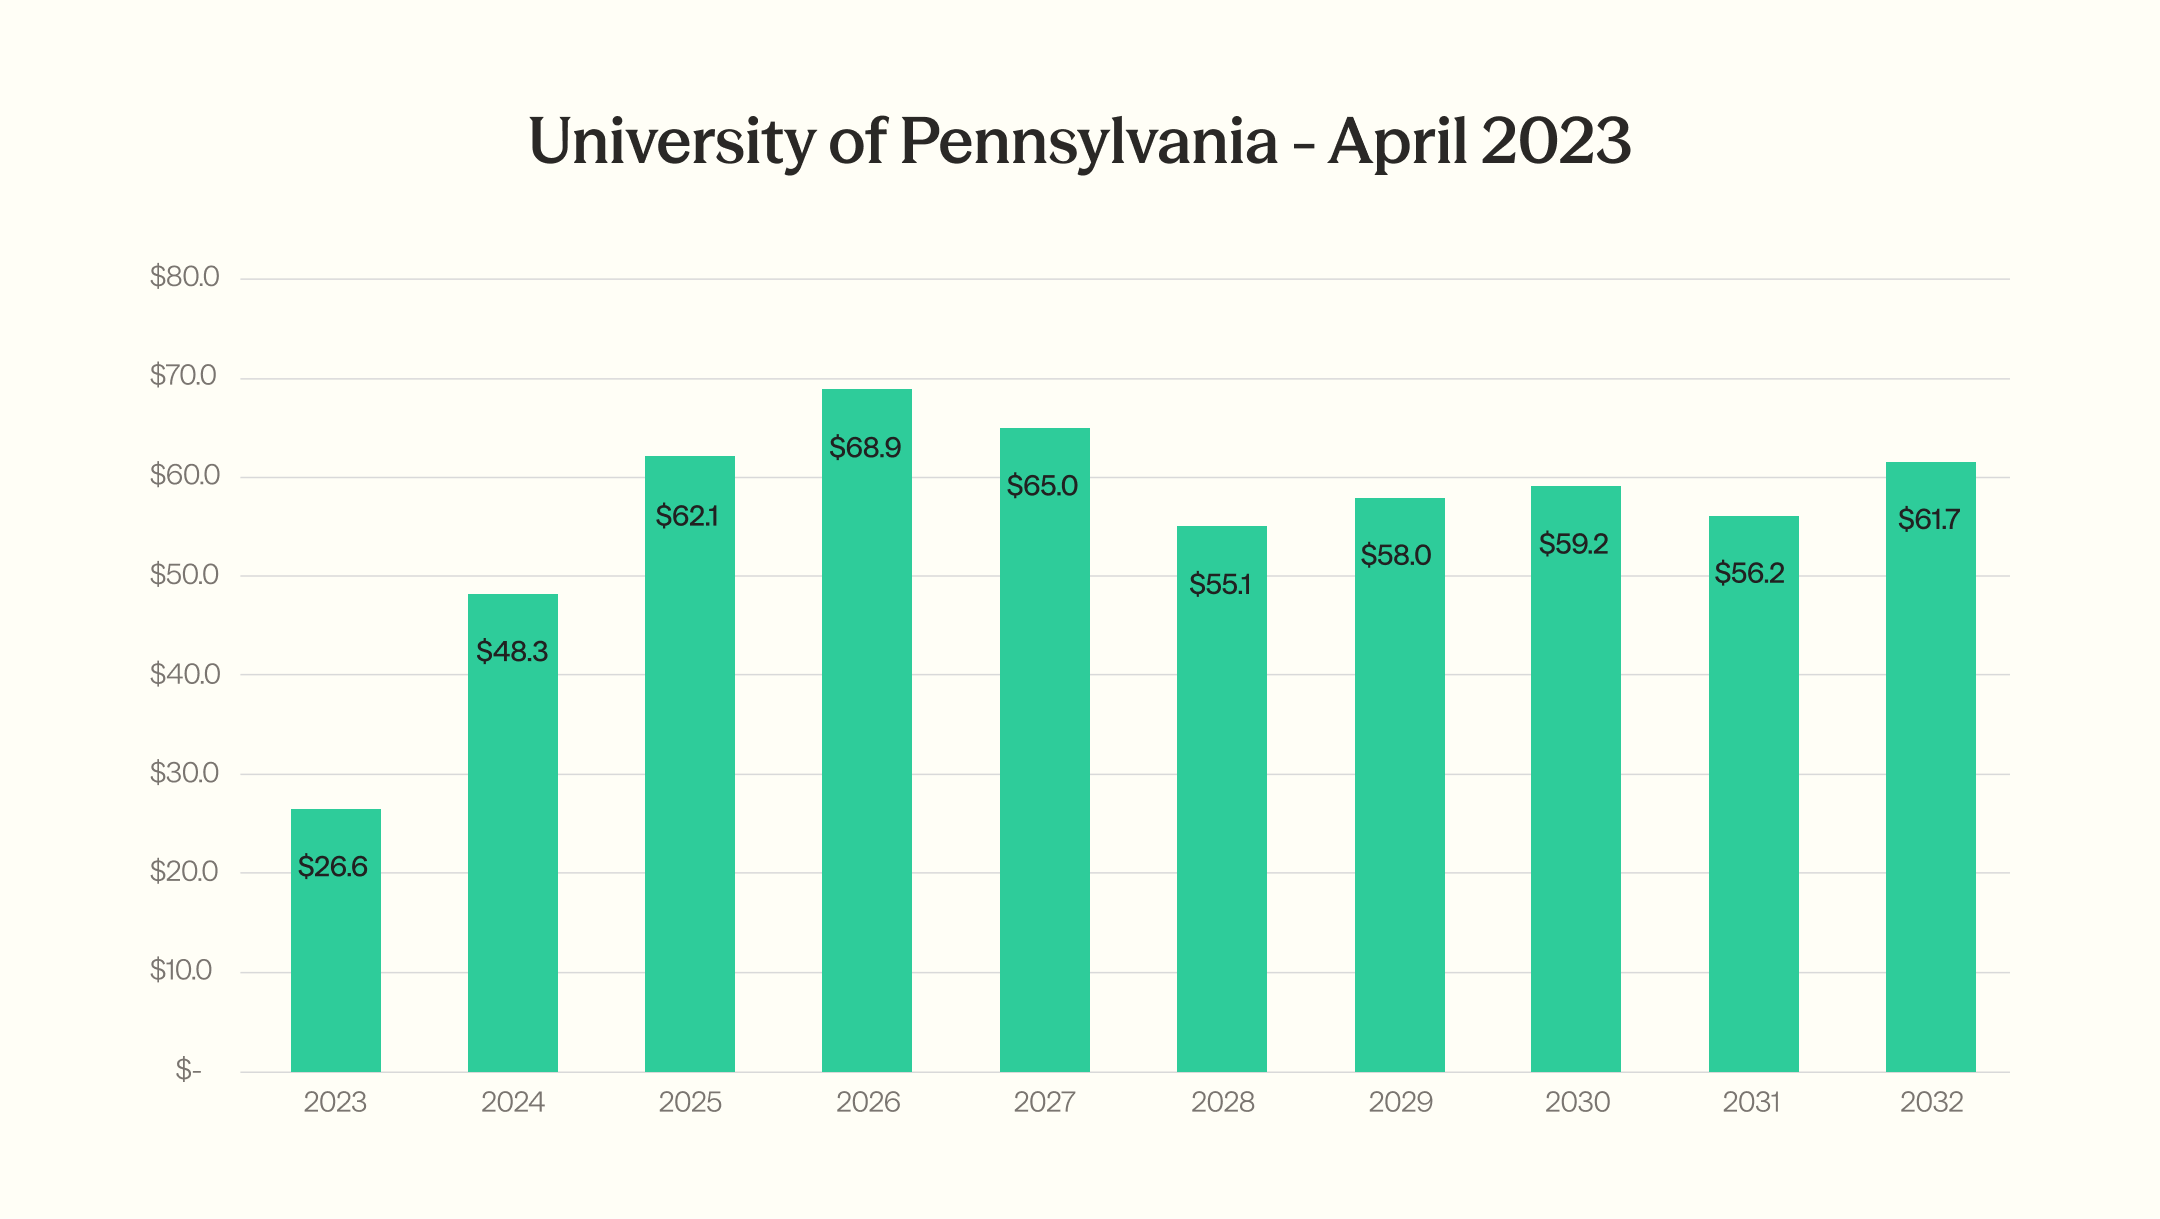
$48B | University of Pennsylvania, Penn Wharton Budget Model (April 2023)
Shortly after the Goldman Sachs report, PWBM released a third estimate of the budgetary effects of the IRA. Importantly, GWBM relied heavily on the Goldman Sachs report: "In preparing these updated estimates, PWBM consulted with private sector experts to understand the likely growth in utilization by climate and energy provision. We are especially grateful to the energy team at Goldman Sachs who helped break down each area and further aided our efforts to produce a budget score against the pre-IRA baseline."
PWBM estimated the total cost of the IRA's energy and climate provisions from 2023 through 2032 – a new ten-year window – at $1.0T. If we isolate transferable tax credits, we arrive at a total of $561B.
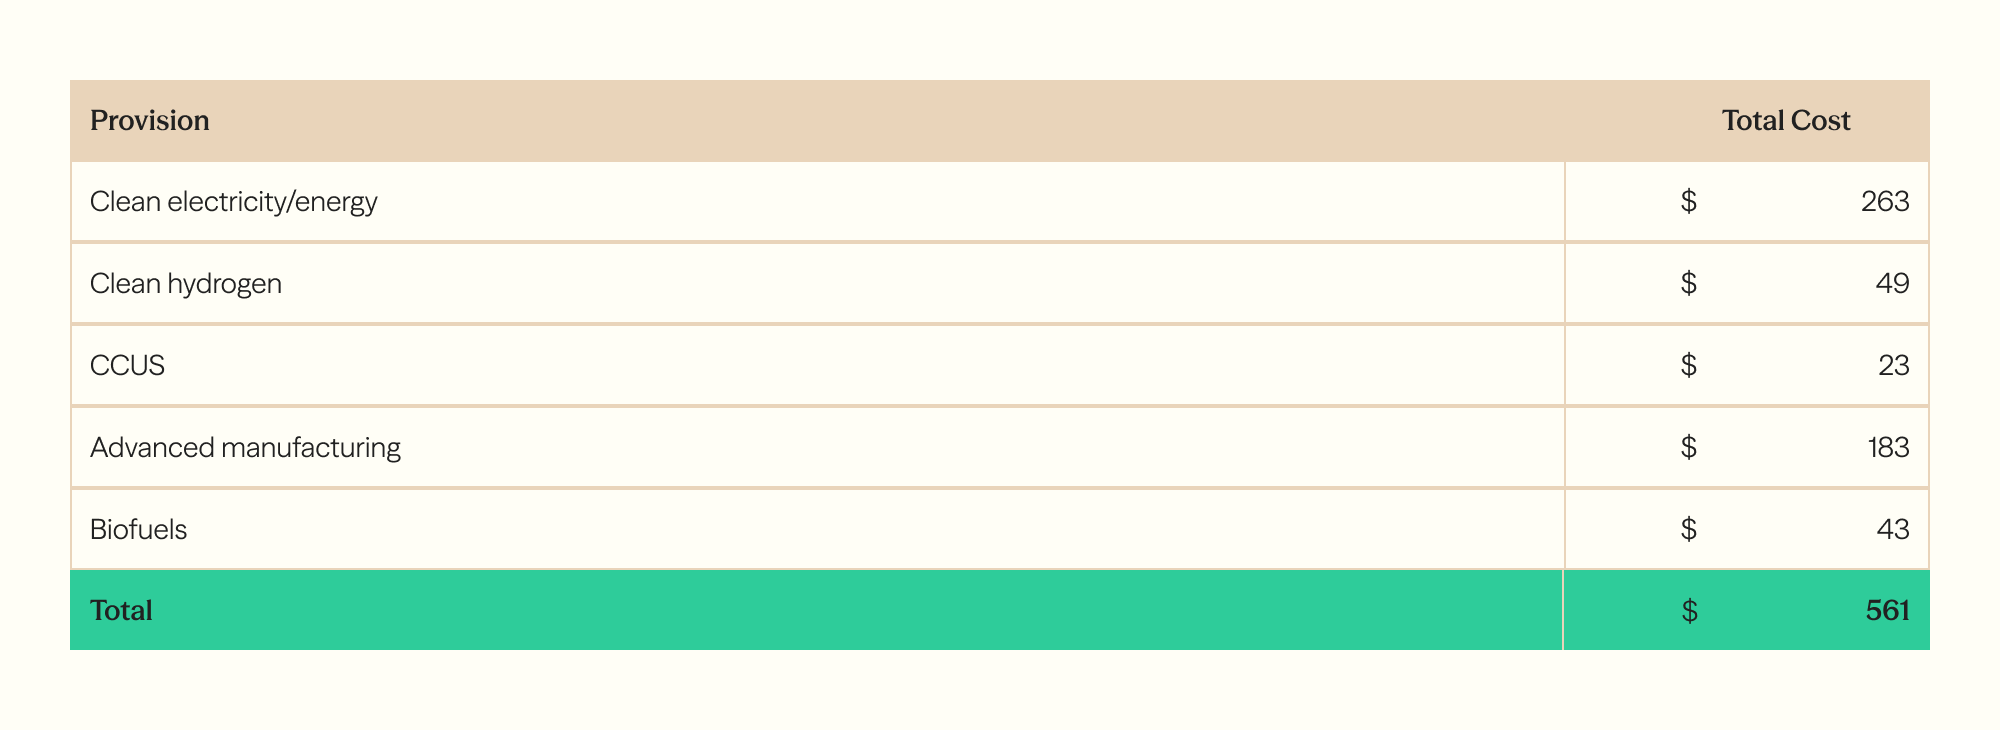
We can allocate the $561B total over the ten-year window, assuming a similar annual allocation percentage from PWBM's earlier estimates. Under this assumption, we get $48.3B for 2024.
$47B | Evercore ISI (April 2024)
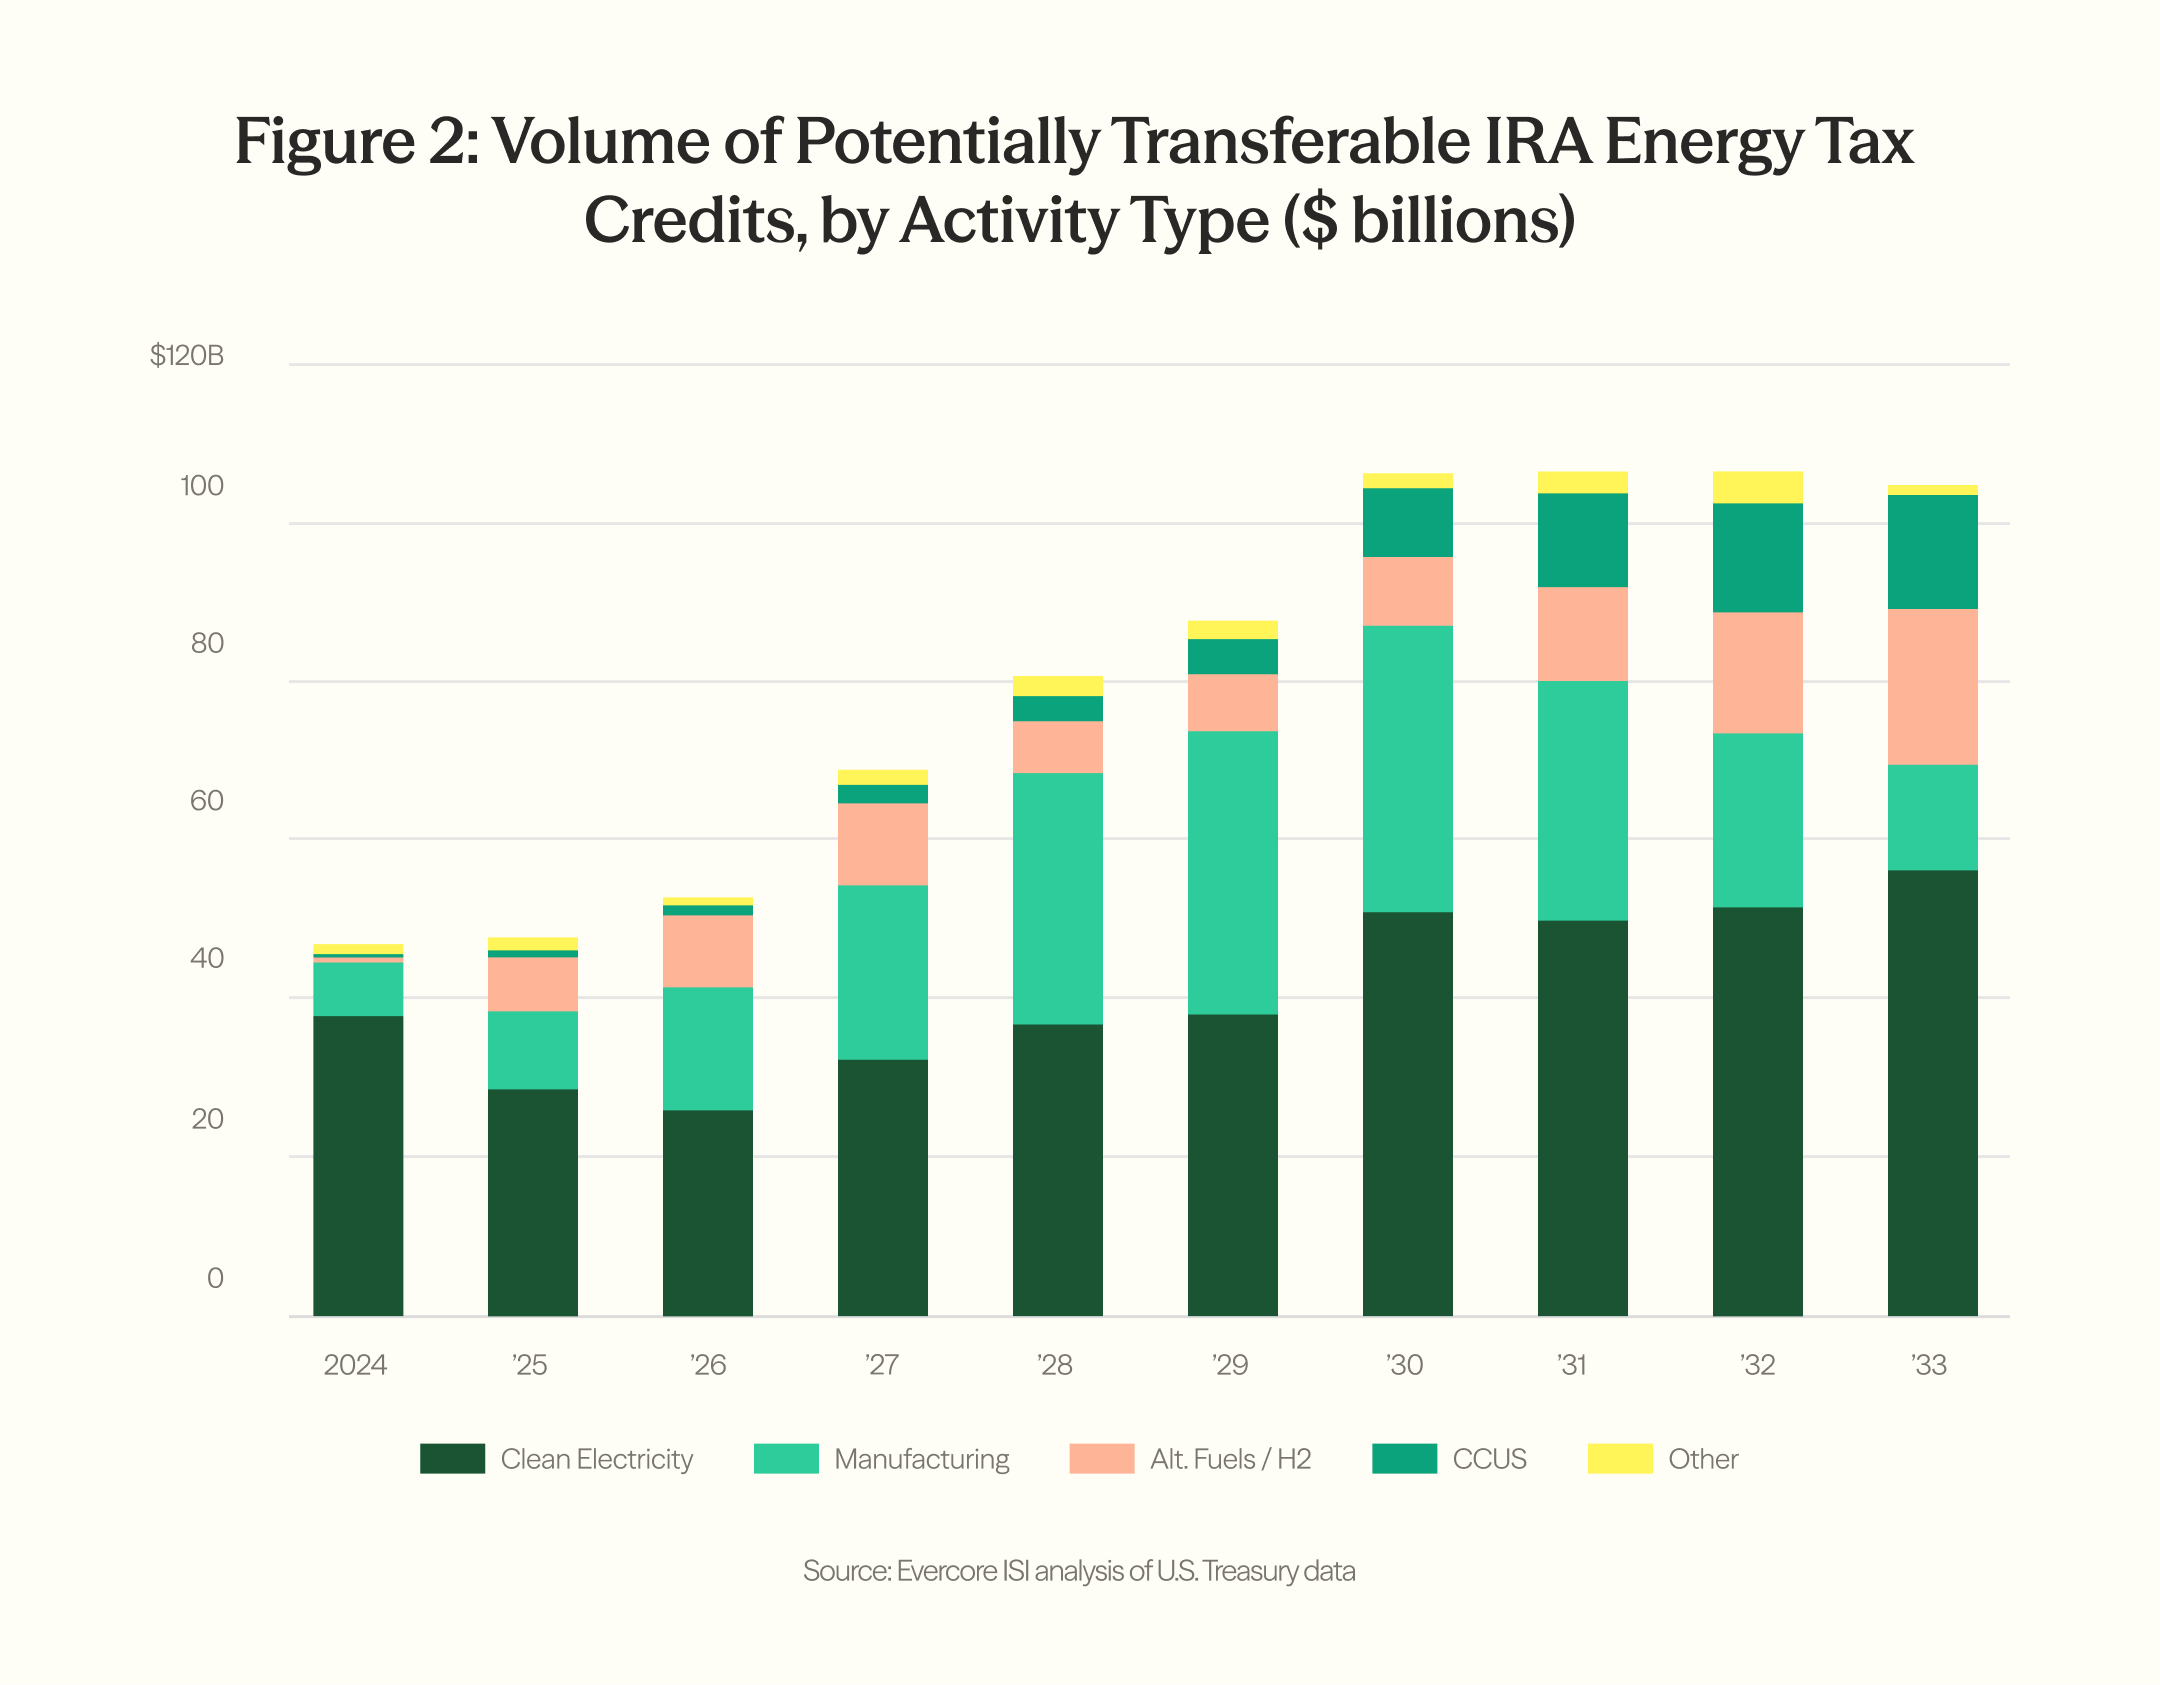
“Drawing on projections from the U.S. Treasury,” Evercore ISI estimated that the “total addressable market of potentially transferable energy tax credits is $47 billion in 2024.” Evercore notes that “not all these credits will ultimately be transferred” – a key detail we'll explore below.
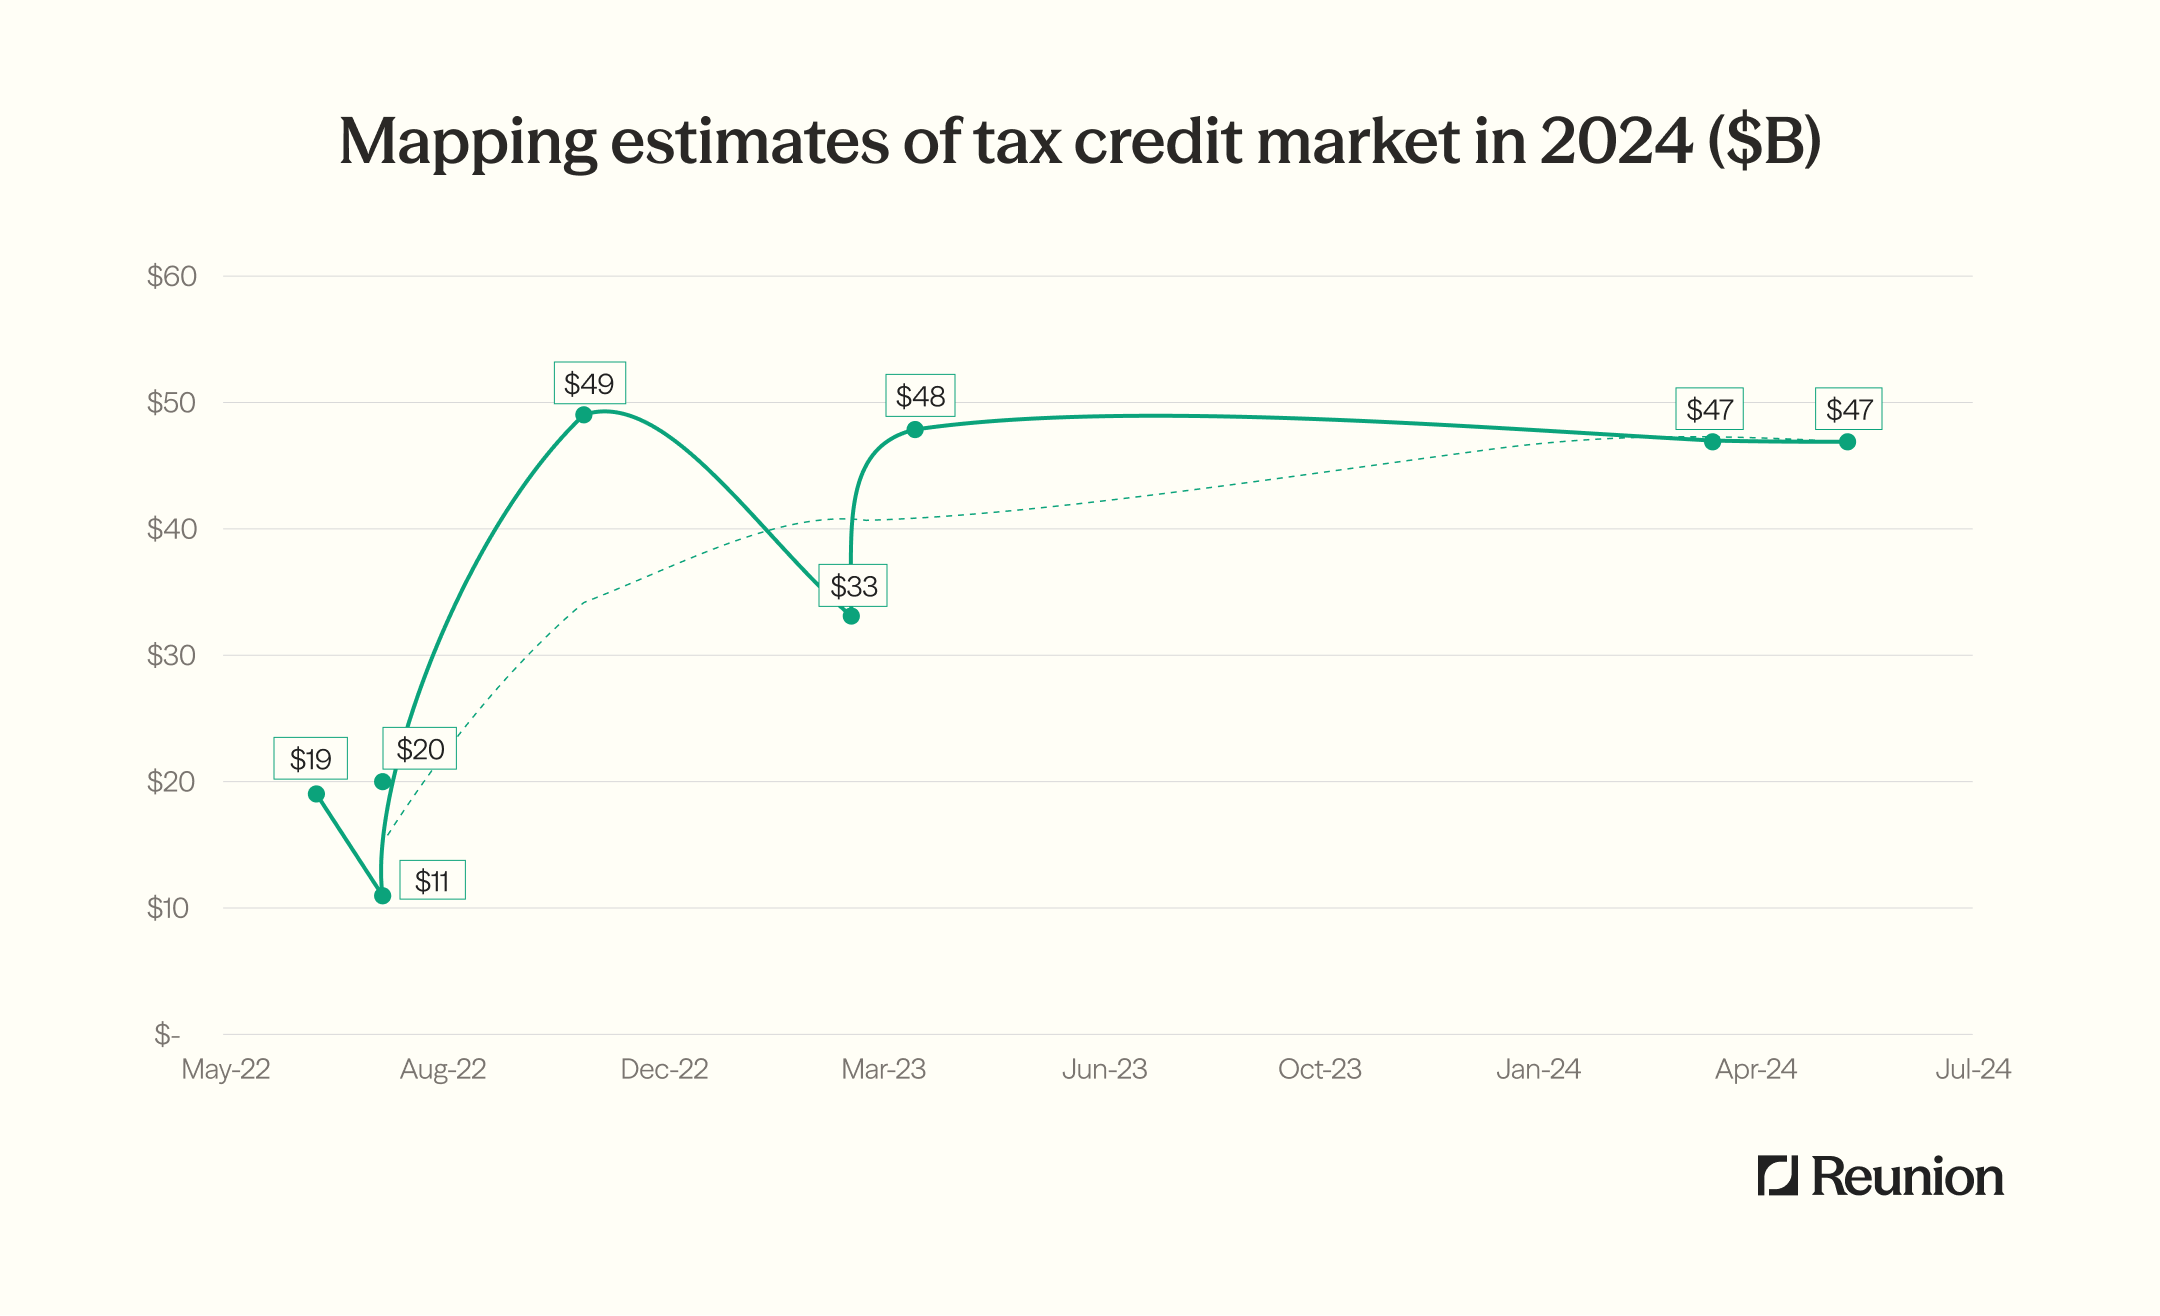
Viewing the estimates through time
When viewed through time, the eight estimates we've examined exhibit two trends:
- A significant increase in estimates following the passage of the IRA: Before August 2022, estimates of the volume of tax credits that would be generated following the passage of the IRA were clustered below $20B. After the IRA became law, estimates markedly increased
- Clustering between $45B and $50B: More recent estimates have tended to fall in the high $40B range
Tax Equity: $21B - $23B
How many clean energy tax credits that are eligible for transferability will be monetized through traditional tax equity in 2024?
With the passage of the IRA, clean energy tax credits can be monetized through transferability, traditional tax equity, or "hybrid" structures involving some mix of both. To properly size the transferability market, then, we need to remove "pure play" tax equity.
Although precise tax equity transaction volumes are not publicly available, Norton Rose Fulbright provides reliable snapshots in their annual cost of capital webinar. In the 2024 cost of capital webinar, for example, Jack Cargas of Bank of America and Rubiao Song of JPMorgan estimated the 2023 tax equity market at $20B to $22B:
- Jack Cargas, Bank of America: "We estimate that the volume was $20 to $21 billion [in 2023], roughly in the same ballpark as the year before."
- Rubiao Song, JPMorgan: "We saw a slight uptick in tax equity volume in 2023 compared to 2022. We put the traditional tax equity at $21 to $22 billion in 2023."
We can create a ten-year series by reviewing the transcripts from prior years – 2023, 2022, 2021, etc.
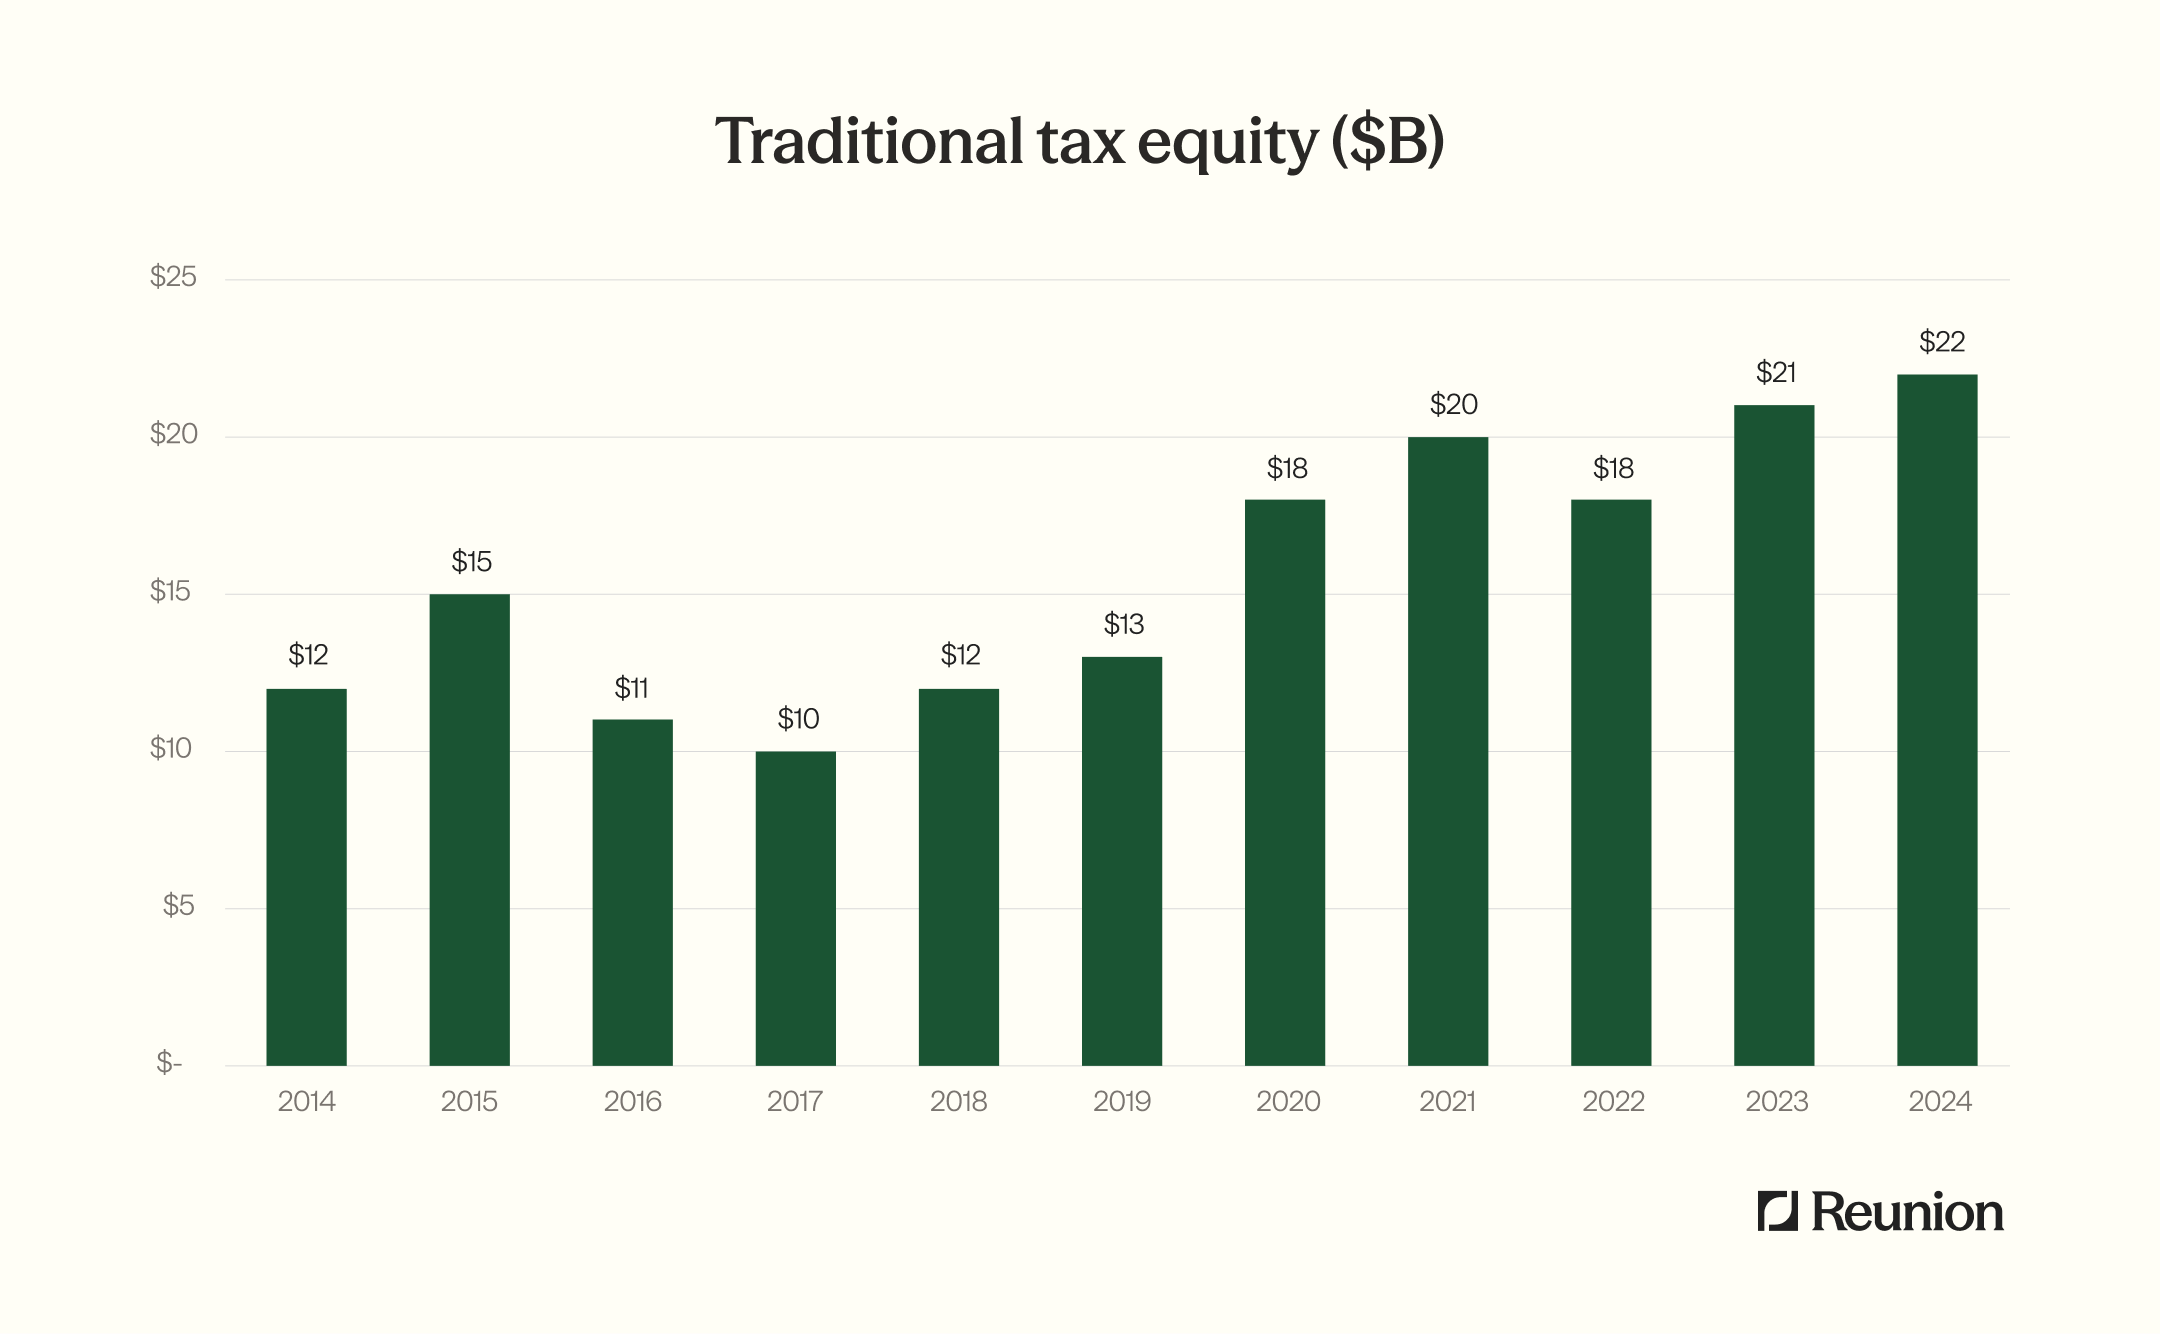
When estimating 2024 tax equity volumes, Rubiao Song said, "If the economy remains strong, we could see tax equity volume growing by single-to-low double digits."
Despite uncertainty around the potential impacts of Basel III requirements on tax equity investments, Reunion estimates that $21B to $23B of tax credits will be monetized through traditional tax equity in 2024.
Importantly, the amount of tax equity investment is not directly representative of tax credit generation, as some amount of investment is associated with benefits of depreciation and the rights to future project cash flows. However, for purposes of this simplified analysis, we have ignored this distinction and will address it in future discussions.
Direct Pay: $0.8B - $1.0B
How many clean energy tax credits that are eligible for transferability will be monetized through direct pay in 2024?
Of the approximately $47B in 2024 tax credits that are eligible for transfer, some will be monetized through direct pay. As Evercore notes in their report, "For a subset of credits" – 45X, 45Q, and 45V – "companies may take advantage of a time-limited provision through which they can receive the credit as a direct payment from the [IRS] after filing their tax returns."
Evercore goes on to emphasize that, "Figures on project registrations released by the U.S. Treasury suggest that even in cases where the seller would have the option for 'direct pay' after filing tax returns, the vast majority are still opting for transfer."
As the Treasury stated, "More than 98% of...facilities or projects are pursuing transferability."
Based on Reunion's 2024 transactions data, which covers nearly $5B in verified transactions, Reunion estimates $0.8B to $1.0B in 2024 tax credits will be monetized through direct pay in 2024. (We can perform a simple check on our estimate by scaling our $47B total market value by 98%, which results in $0.94B.)
Retain: $1.8B - $2.4B
How many clean energy tax credits that are eligible for transferability will be monetized directly by the developer, manufacturer, or refiner in 2024?
Based on SEC filings from large, publicly traded utilities, Reunion estimates that 4% to 5% of 2024 tax credits will be retained by developers, manufacturers, and refiners to offset their own tax liability. They will not, in other words, transfer all of their IRA tax credits.
In their 2023 10-K, for example, Duke Energy states, "...due to its existing tax attributes and projected tax credits to be generated related to the IRA, Duke Energy does not expect to be a significant federal cash taxpayer until around 2030."
Reunion's estimates that $1.8B to $2.4B of clean energy tax credits will be retained by their originator.
Transfer: $21B - $24B
How many clean energy tax credits will ultimately be transferred in 2024?
In the simplest sense, tax credit transfers become the "plug" in our equation: [total tax credit market] = [tax equity] + [direct pay] + [retention] + [transfer].
Recognizing that we have provided estimated ranges for each value, we can create a "high" and "low" case resulting in an estimated transfer market range of $21B to $24B.
"Stranded" Credits
How many clean energy tax credits will fail to be monetized, irrespective of strategy?
Although we've focused our anaylsis on accretive monetization strategies, it's worth noting the existence of a fifth bucket: "stranded" credits. These are credits that are generated but, for whatever reason, not monetized through tax equity, transferability, direct pay, or retention.
Reunion has seen stranded credits first-hand with smaller developers who were unable to successfully transfer 2023 credits with values in the low hundreds of thousands. We also assume some stranded credits will emerge from developers in financial distress.
We believe stranded credits constitute a de minimis and hard-to-estimate segment of the transferability market and have excluded them from our analysis.
Looking Ahead
How many clean energy tax credits will be eligible for transfer through the early 2030s? Of these, how many will be transferred?
We expect the overall tax credit market to grow by an average of 10% to 15% per year, peaking in 2030. The highest percentage of this growth will occur in transferability (versus other monetization strategies). We estimate that the total tax credit market will approach $700B through 2032, over $350B of which will be monetized through transferability.
We ran our estimate through 2032 for two reasons. Under the §45X credit, manufactured components are subject to a four-year phase-down beginning in 2030 (75%, 50%, 25%, 0%). Therefore, manufactured components will no longer be eligible for the §45X after 2032. Also, 2032 is the first potential "applicable year" for the four-year phase-out of the §45Y PTC and §48E ITC.
Further updates to come
Reunion will update and refine this analysis as we facilitate more transactions and further data comes to market. If your team has data to share on an anonymized basis, we would welcome the opportunity to connect.

