Six Tax Credit Takeaways from Analyzing 6,000 Public Company Filings
A data-driven look at how companies are participating in the transferable tax credit market


Section 6418 of the Internal Revenue Code — effective for tax years beginning after December 31, 2022 — created something that did not previously exist in the U.S. tax code: a market for companies to purchase clean energy tax credits.
While the market has grown quickly, it has historically been difficult to get a clear picture of what companies are making tax credit purchases. This is now changing with the introduction of ASU 2023-09, a new accounting standard which requires more granular tax disclosures, making credit purchases easier to detect. ASU 2023-09 took effect for fiscal years beginning after December 15, 2024 (for public companies), which will drive greater visibility into market trends.
Reunion analyzed over 6,000 public filings across 1,400 of the largest US-listed companies, covering 10-Ks and 10-Qs submitted between January 2025 and May 2026. An AI-assisted process screened each filing for tax credit purchase disclosures; human reviewers then verified all identified activity. This represents an early snapshot: the dataset expands continuously as new filings are released.
Below are six key takeaways from our filings analysis through March 2, 2026. The Wall Street Journal featured our research in a recent article.
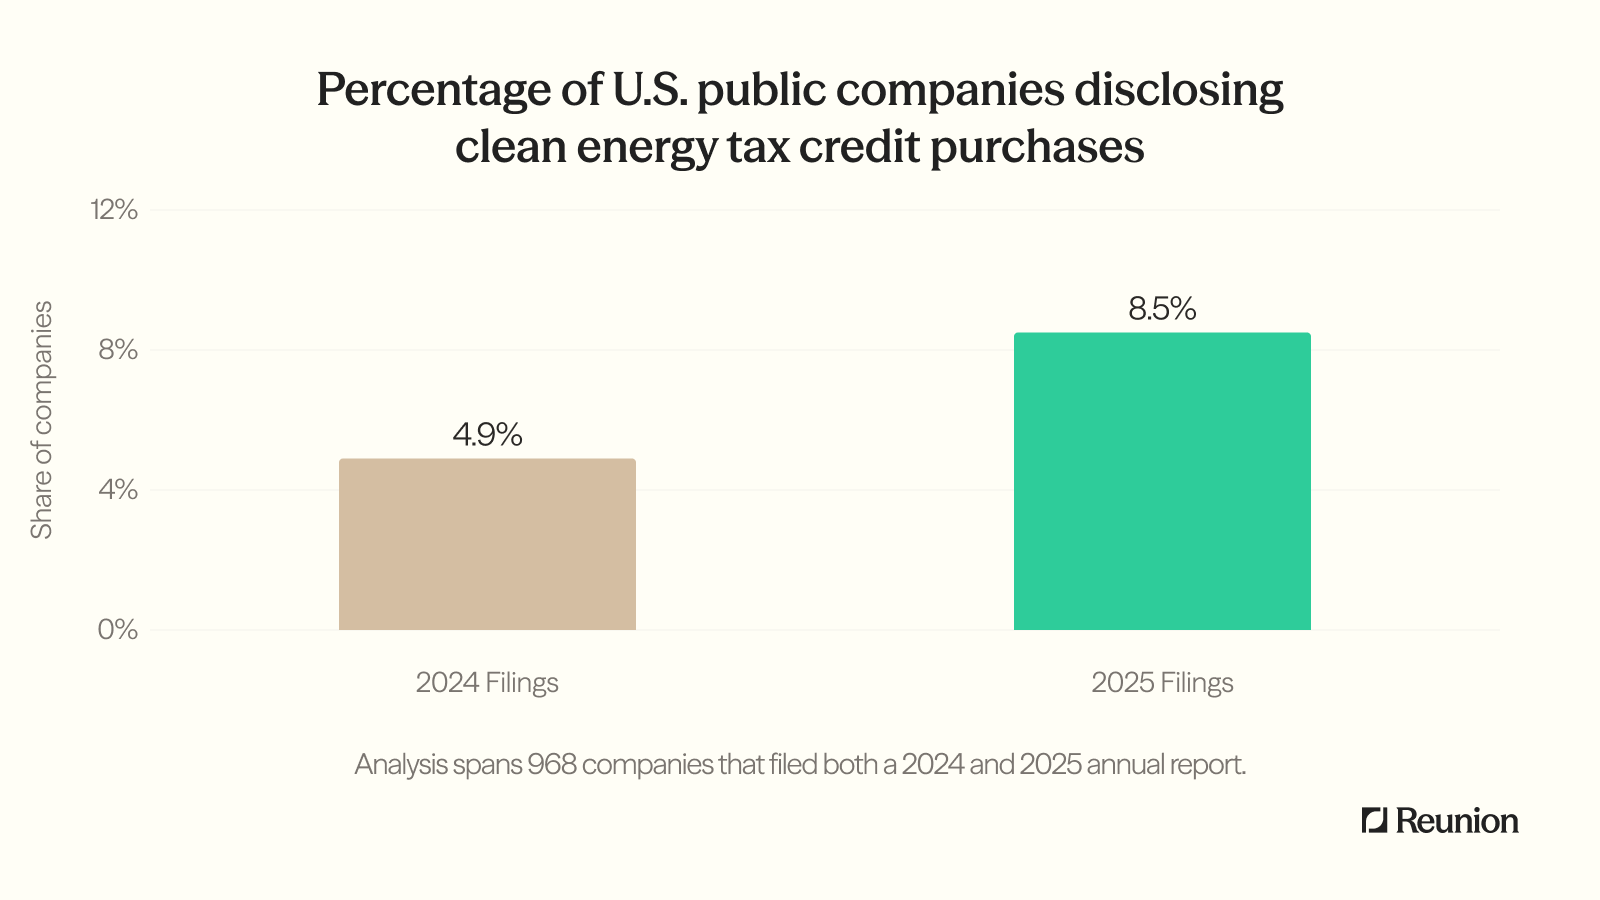
Insight 1: Buyer Participation Has Nearly Doubled — With Smaller Companies Accounting for 62% of Growth
Across the nearly 1,000 public companies in our dataset that filed annual disclosures in both 2024 and 2025, we found that the share of firms disclosing tax credit purchases rose from 4.9% in 2024 to 8.5% in 2025.
The growth is even more pronounced among smaller taxpayers. Companies with under $200M in annual tax expense doubled their purchase rate year-over-year, from 21 buyers to 42 buyers in the matched sample. Purchasing among larger taxpayers also grew, albeit at a 50% rate – from 26 to 39 buyers.
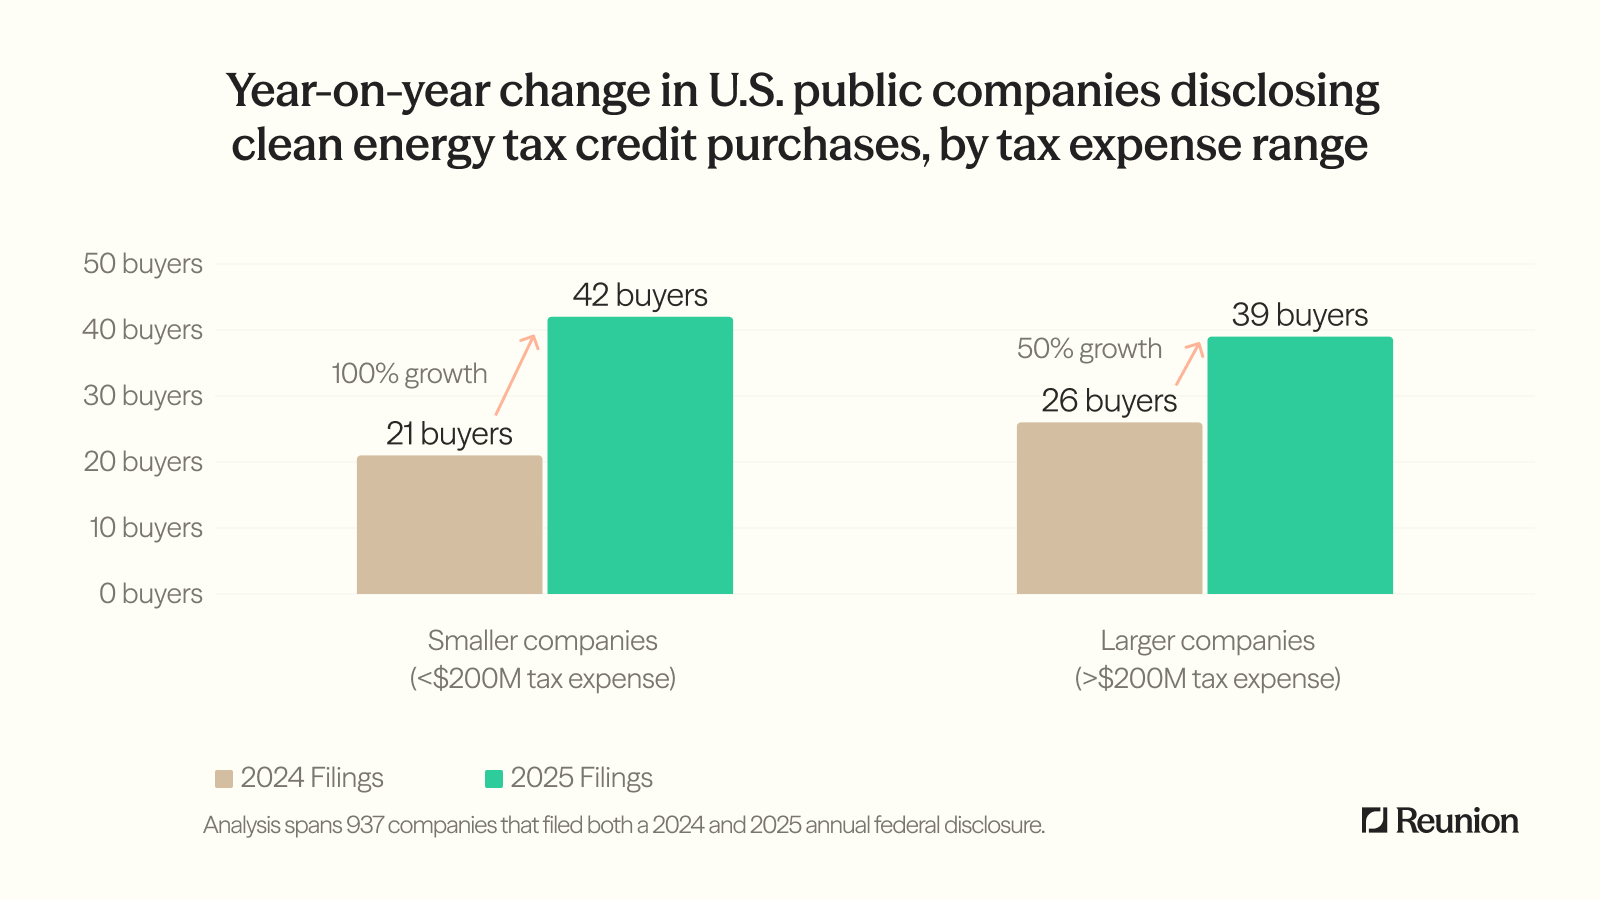
Participation is broadening thanks to more standardized deal structures, increases in credit supply, and clarified IRS guidance. What began as a large-cap strategy is increasingly common among more modest taxpayers. We expect further convergence of tax credit purchase rates among company size cohorts as the market matures.
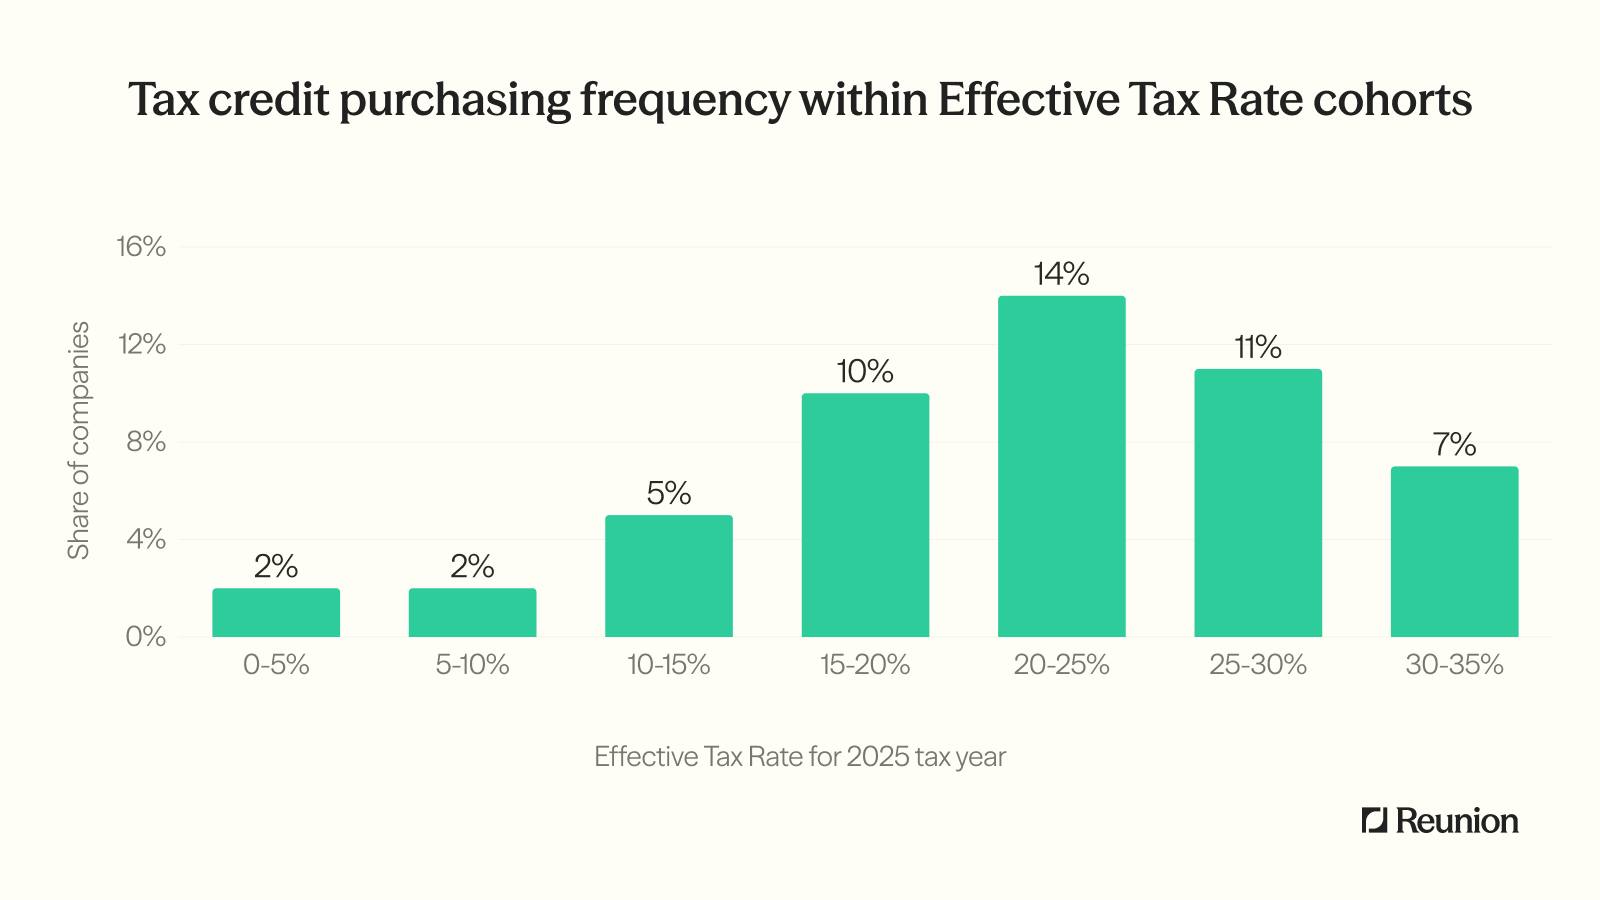
Insight 2: Tax credit purchase rates are highest for corporate taxpayers with ETRs in the 15% to 30% range
Our analysis of filings for the 2025 tax year suggests that over 10% of companies with ETRs in the 15% to 30% range purchased tax credits.
Purchase rates among companies with ETR’s of 20-25% are roughly 7 times higher than for companies with ETR’s below 10%.
Insight 3: Reductions in Effective Tax Rate Have Clustered Between 0.4% and 2.0%
Many companies purchase transferable tax credits with the express goal of “managing” their effective tax rate (ETR). Others focus on cash tax savings, although this, too, has an impact on ETR.
The chart below shows that nearly 80% of companies that purchased transferable tax credits in 2025 lowered their ETR between 0.4 and 2.0 percentage points – for example, from 23.2% to 21.2% for a 2.0% reduction.
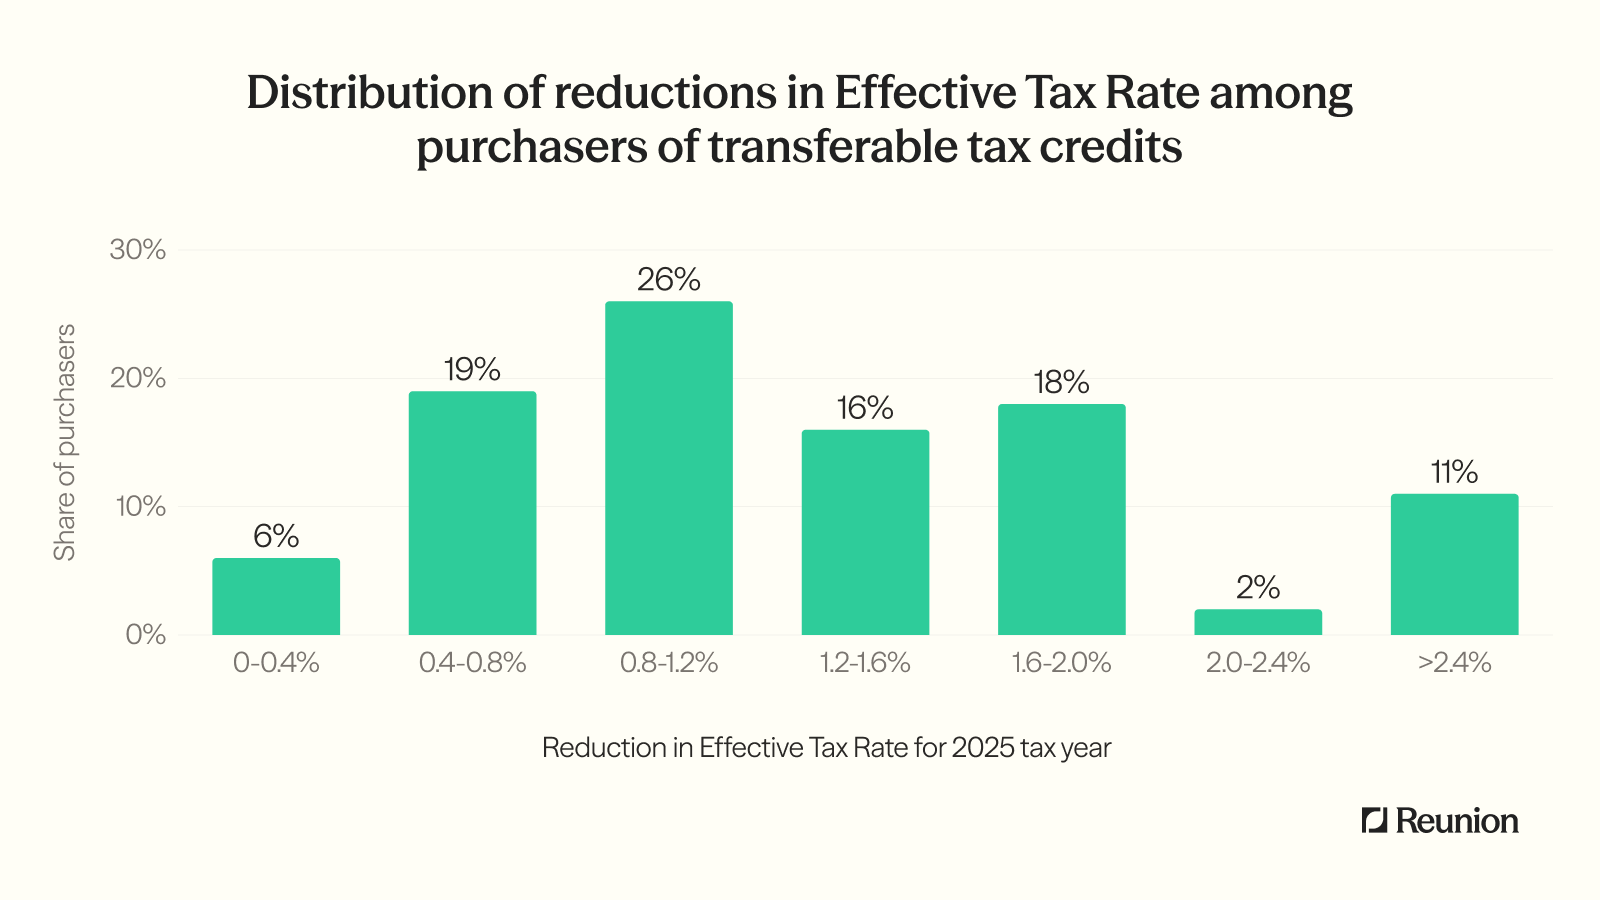
Our analysis identified outliers at both ends of the distribution (see Methodology Note). Multiple companies reported effective tax rate reductions in excess of 5.0%.
Insight 4: Tax Expense Is the Strongest Predictor of Purchasing
Our analysis shows that purchase rates increase steadily as annual tax liability rises — then drops at the very highest levels.
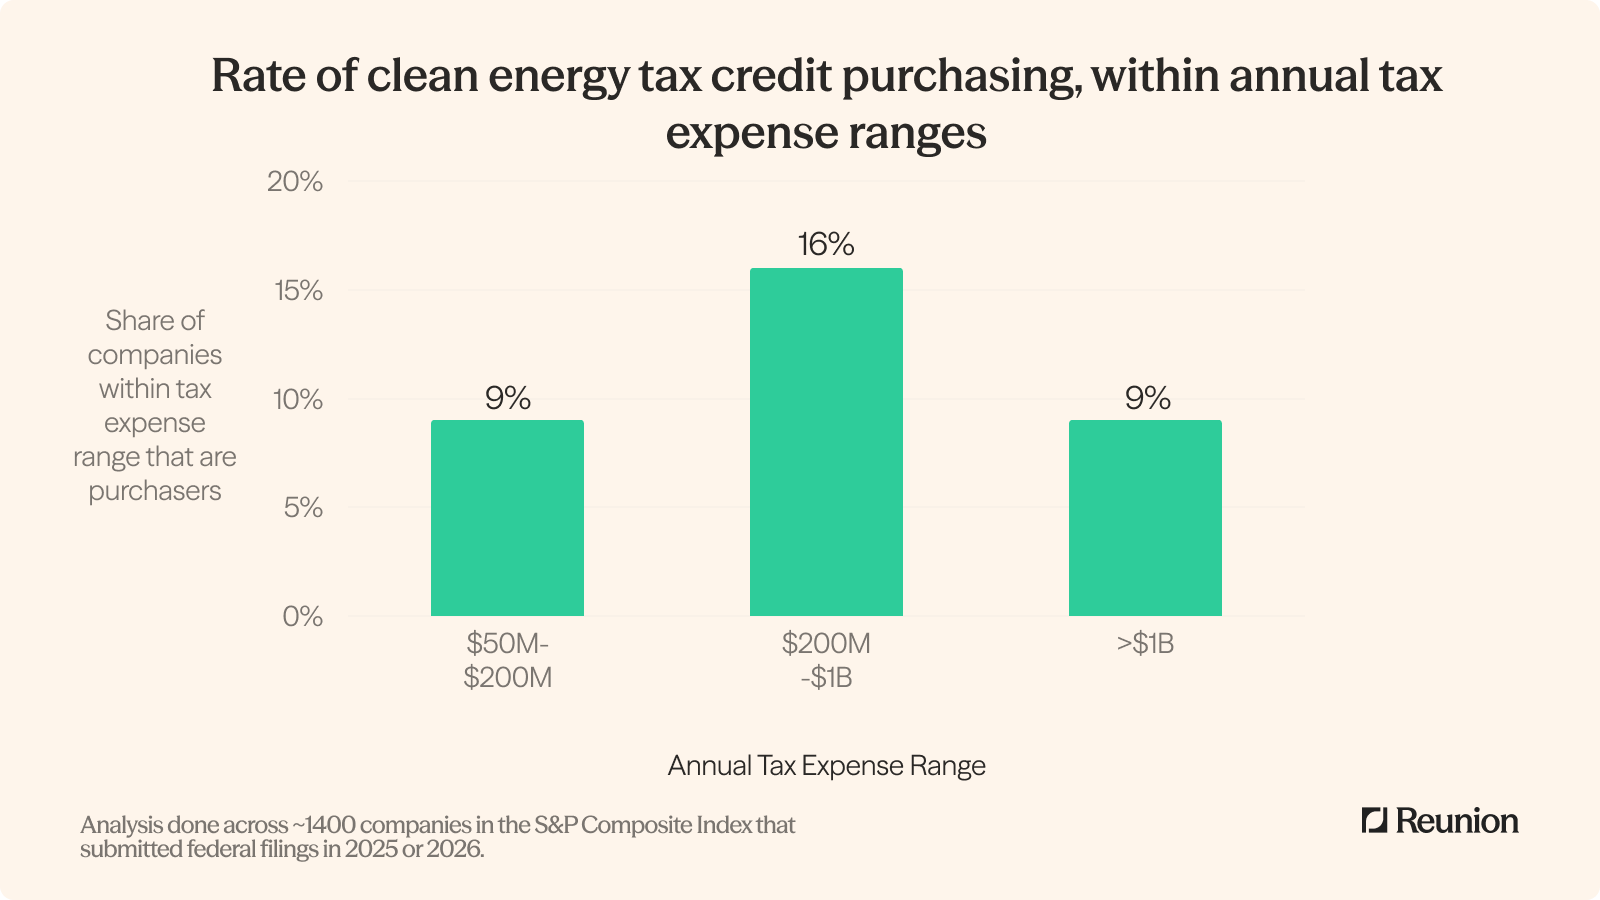
Why the drop above $1 billion in annual tax expense? Very large corporations often have more alternatives when it comes to tax reduction strategies, such as complex deductions and cross-border tax planning. Deployment of these alternate strategies may translate into a dampened interest in buying transferable credits.
At the same time, we also know from our work in the tax credit market that many extremely large buyers do not acquire tax credits at a level that crosses the reporting thresholds prescribed in ASU 2023-09. If we were to layer these companies into our analysis - perhaps in a future report – we would expect a less dramatic drop.
We tested other size proxies, including revenue, employee count, and market capitalization. All are positively correlated with purchasing, but are also highly correlated with each other. Among all such size proxies, tax expense shows the strongest relationship with purchase behavior.
Insight 5: Tax Credit Purchasing Has Gained Traction Nationwide — with a Notable Outlier
The market is attracting companies from all regions. More than 30 states are home to at least one public company that has disclosed transferable tax credit purchases.
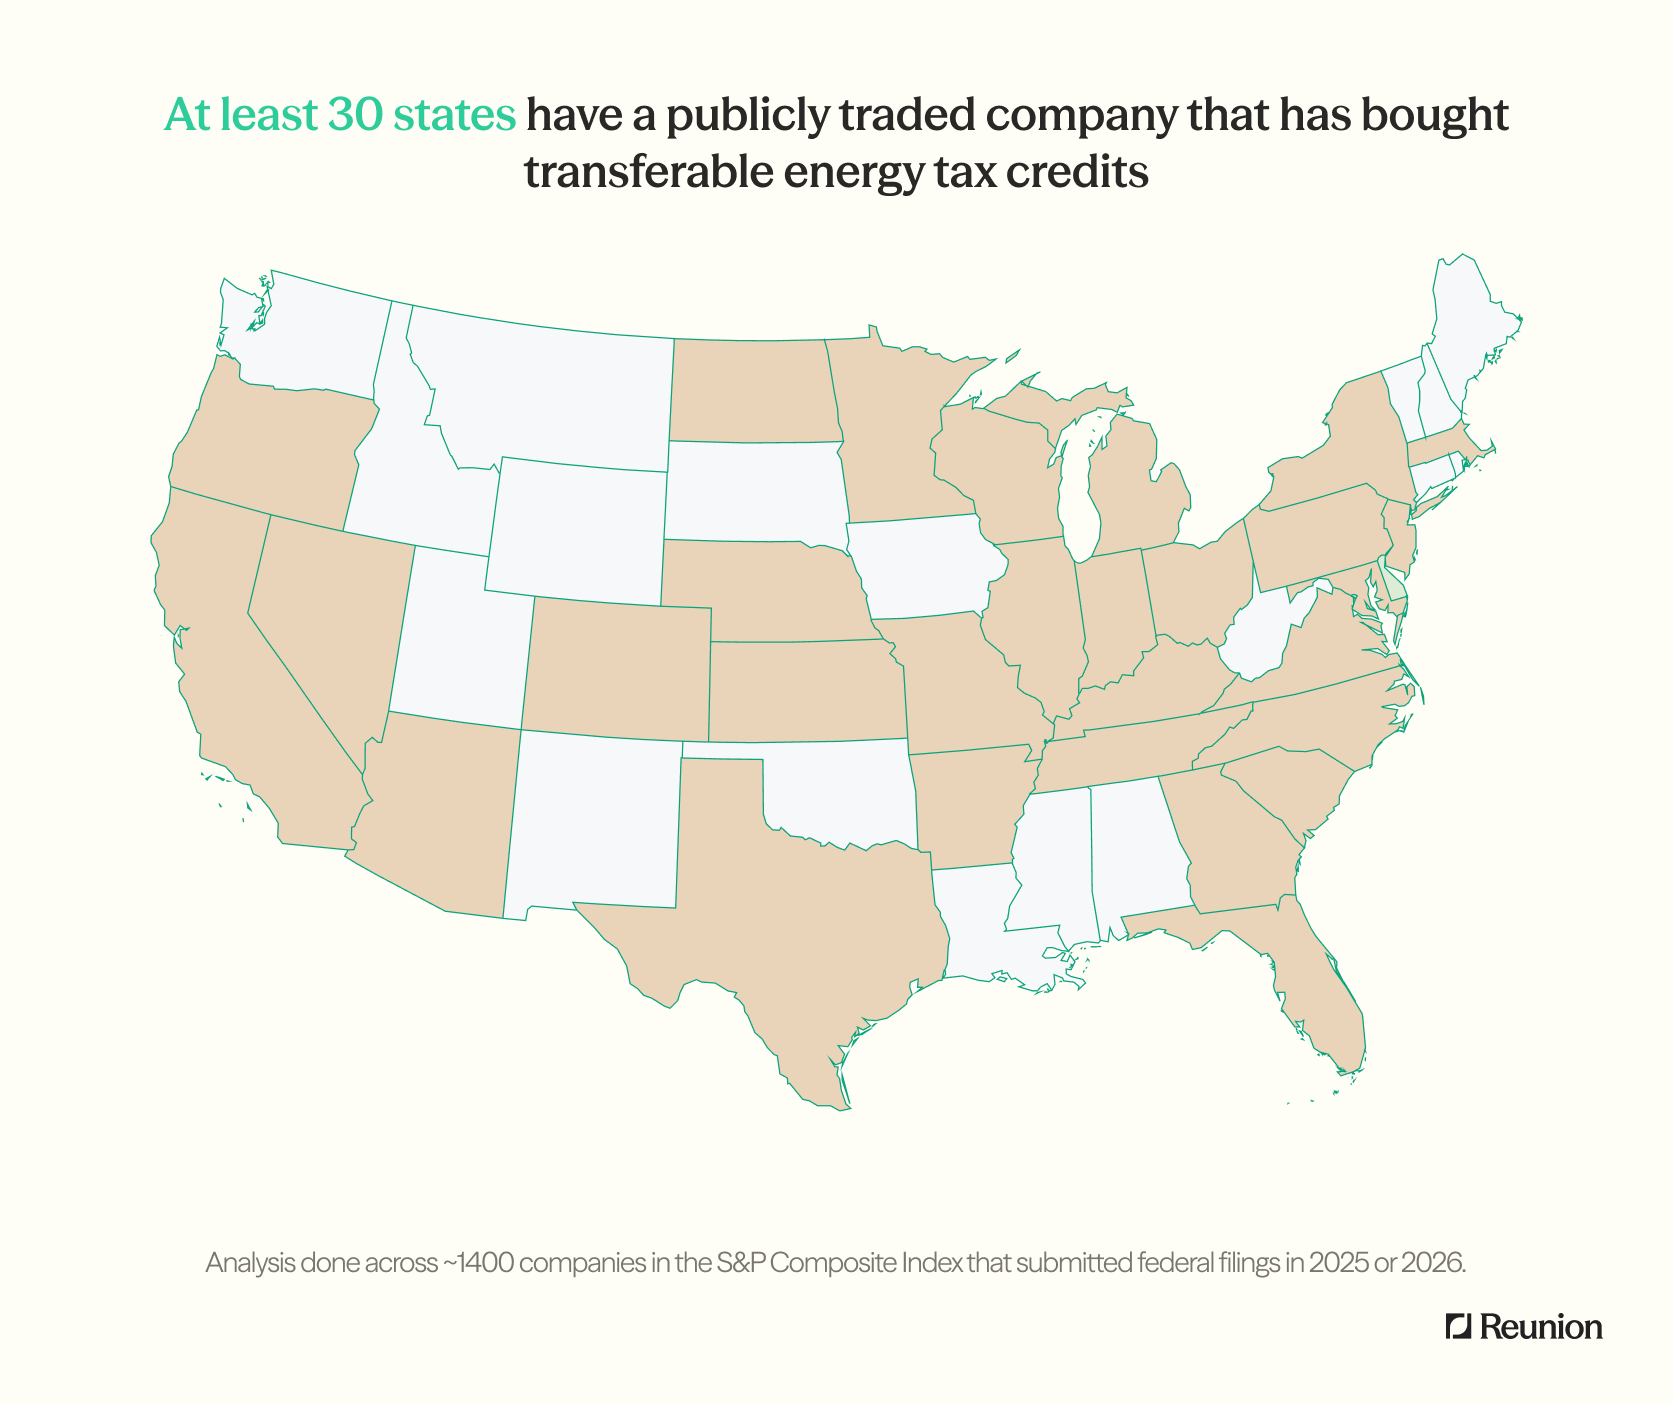
It’s also worth noting that the actual number of states associated with corporate tax credit purchasing is greater than shown in the map above. For example, Reunion has worked with tax credit buyers in a number of the non-highlighted states including Idaho and Washington, but these buyers do not register in our analysis of federal filings because the buyers were either private companies or public companies that have yet to make tax credit disclosures in federal filings.
One state stood out in our geographic analysis – for its surprisingly weak buying activity.
California-headquartered companies purchase at less than half the national rate (3.4% vs. 8.5%). This gap persists across tax expense bands and across sectors.
A contributing factor may include that California’s technology companies already have robust tax reduction channels through their R&D spending and capital expenditures. One other observation is that prior to SB 302 (a California law effective January 2026), the state did not conform to IRC §6418 for tax purposes. Therefore, the discount on a purchased credit (e.g., buying a $100M credit for $90M) was potentially subject to state-level taxes for tax years before January 1, 2026.
Insight 6: Retail and Construction Stand Out
Purchase rates show meaningful variation across industries, with construction and retail leading the charge.
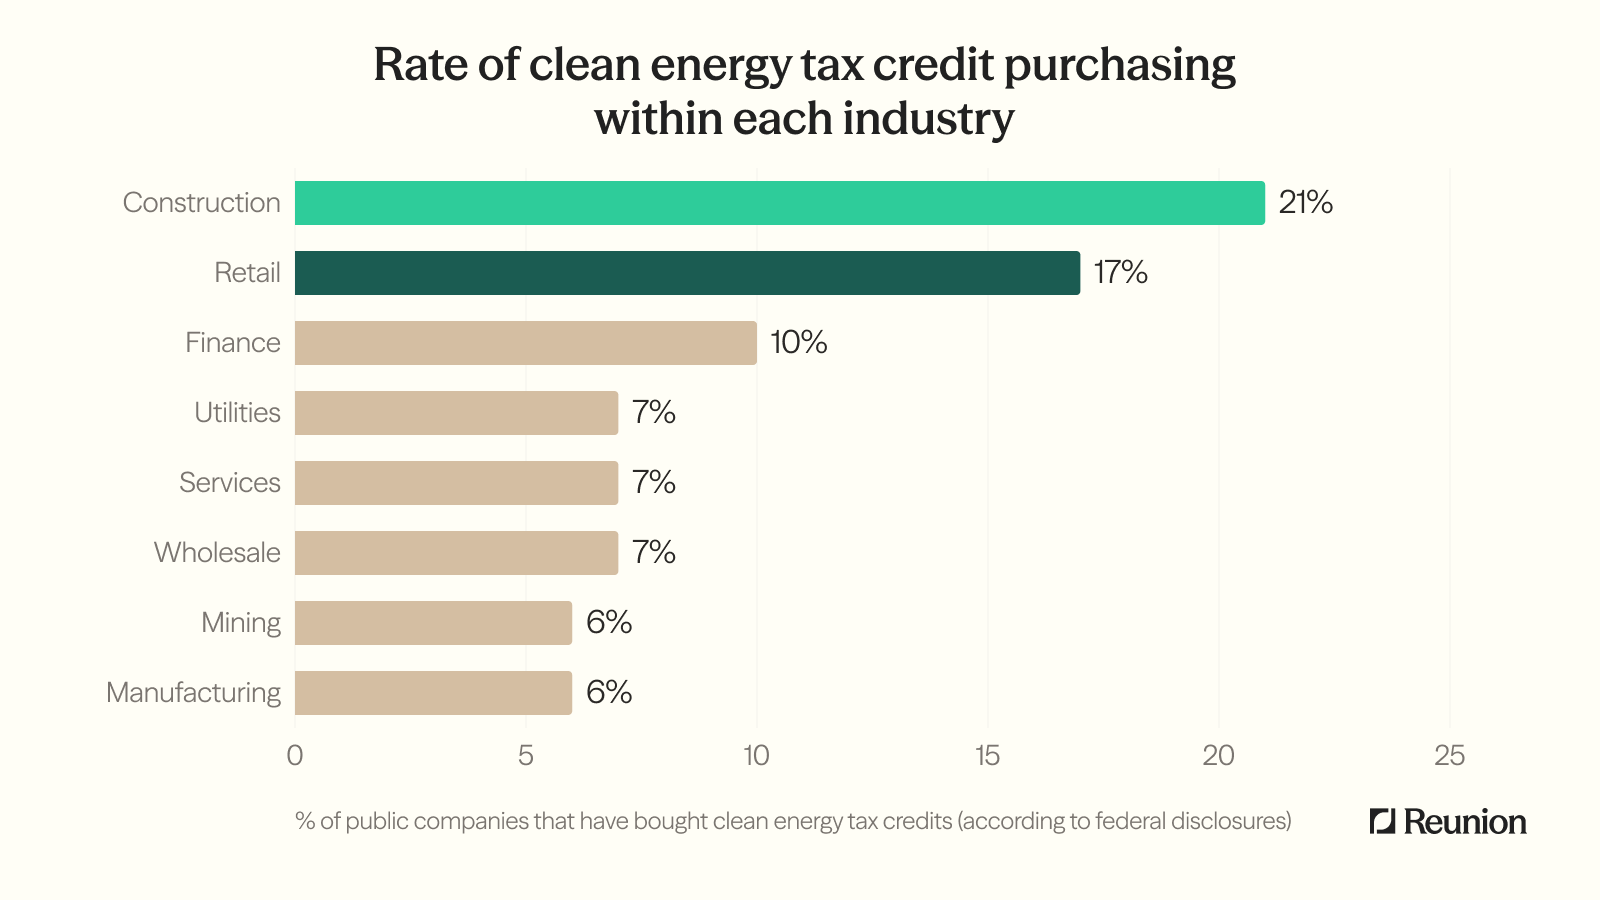
Factors leading construction companies toward greater tax credit purchases include predictable federal tax liabilities, and limited availability of tax strategies such as R&D credits and international structuring opportunities. Retail faces similar structural characteristics — often more acutely. Retail R&D intensity is minimal relative to technology or pharma, and retailers face large and recurring domestic tax expenses.
For many companies in these industries, transferable credits are the first meaningful new federal tax reduction tool in decades.
In Summary
Our analysis suggests that the transferable tax credit market continues to evolve in several important ways. Activity is increasing overall, participation is extending beyond the largest revenue companies, and geographic concentration is gradually dispersing. We are also observing particularly strong engagement in industries that historically have had limited access to tax credit opportunities.
Recent disclosure changes are making transaction activity more transparent, while market infrastructure continues to mature. As a result, buyer participation patterns are becoming easier to identify and evaluate.
This represents an early snapshot rather than a definitive assessment. As additional 2025 and 2026 filings become available, we will continue to monitor and analyze how the buyer market develops.
Exclusive access to underlying SEC data provided to existing buy-side and sell-side clients of Reunion. Reach out to your Reunion contact for access.
This research was featured in the Wall Street Journal. Read the article here.
Data Notes
Date of analysis: February - March 2026
Universe: ~1,400 of the largest public companies listed in the US
Filings reviewed: 10-K, 10-Q, 20-F, 40-F filed since January 1, 2025
Methodology Notes:
- Many filings reference “transferable tax credits” without specifying credit type. Since transferability is generally tied to Section 6418, we classify them as clean energy credits.
- Of the ~1,400 companies analyzed, roughly 1,000 had filed both a 2024 and a 2025 report during the period we examined. The remainder fall into two categories: companies that have not yet filed their 2025 annual report, and fiscal-year filers whose 2024 filings were published before our data collection began in January 2025. As a result, the year-over-year comparisons are based on the subset of companies for which both filings are available, ensuring an apples-to-apples comparison.
- In our assessment of effective tax rate reductions, we identified one outlier company that experienced an increase in its ETR as a result of the non-recurring accounting treatment associated with an investment tax credit (ITC) recapture event. We omitted this data point in our reported results, but intend to examine this recapture in greater detail in a forthcoming note.