Where Are Companies Buying Transferable Tax Credits? A State-by-State Look
The fourth of five data-driven posts exploring how companies are participating in the transferable tax credit market.

More than 30 states are home to at least one public company that has disclosed purchasing transferable tax credits under IRC Section 6418. But not all states are participating equally.
Reunion analyzed over 6,000 public filings across approximately 1,400 of the largest U.S. public companies to map where buyers are located. ASU 2023-09, a new accounting standard in effect for fiscal years beginning after December 15, 2024, requires more granular tax disclosures by public companies and makes credit purchases easier to verify.
The data shows broad geographic adoption – with one notable exception.
Which States Have Transferable Tax Credit Buyers?
Among the companies we analyzed, these five states housed the headquarters for the most number of companies that publicly disclosed tax credit purchases.
The following map shows which states have at least one verified public company purchaser.
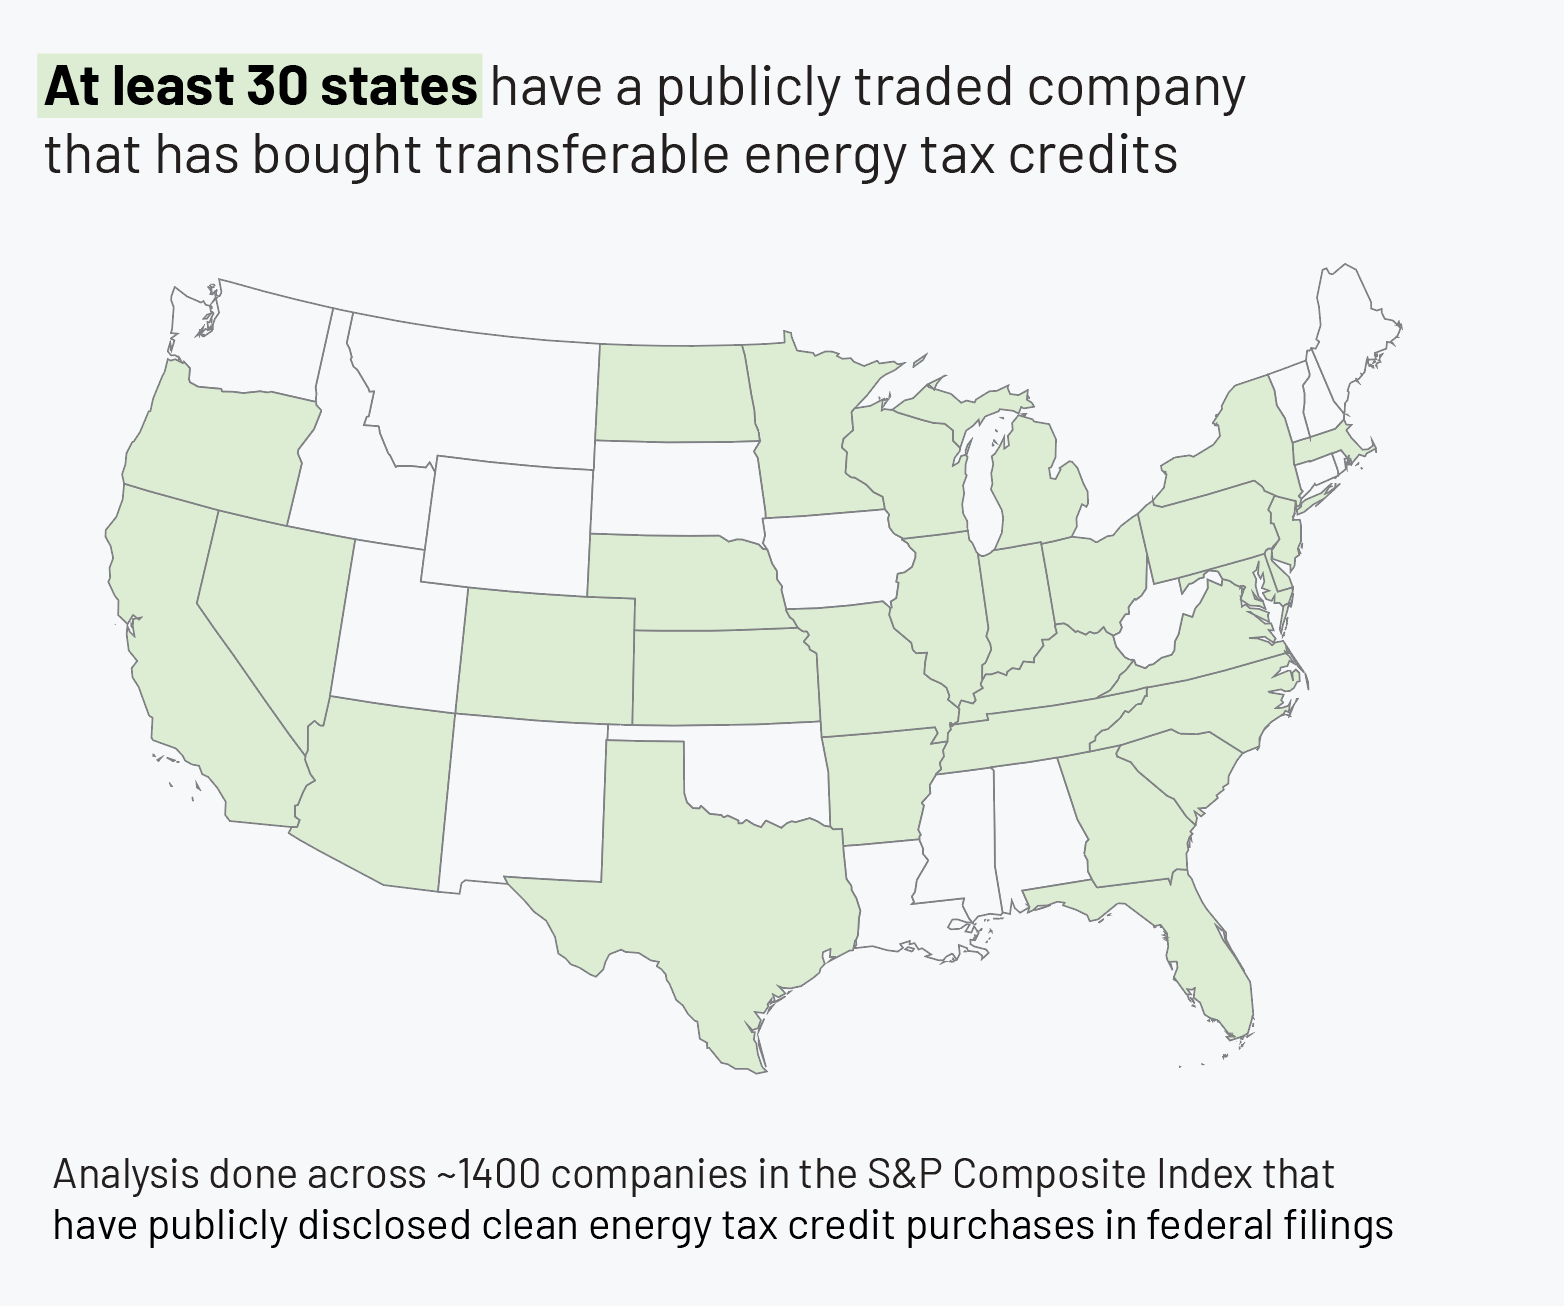
It’s also worth noting that the actual number of states associated with corporate tax credit purchasing is greater than shown in the map above. Reunion has worked with tax credit buyers in a number of the non-highlighted states, such as Idaho and Washington, but these buyers do not register in our analysis of federal filings because the buyers were either private companies or public companies that have yet to make tax credit disclosures in federal filings.
Low Purchase Rate for California Companies
California is home to over 175 of the largest U.S. public companies – more than any other state. It is a leader in installed solar capacity and clean energy investment. Yet California-headquartered companies purchase transferable tax credits at less than half the national rate.
This gap persists across tax expense bands, sectors, and company sizes.
A contributing factor may include that California’s large technology companies already have robust tax reduction channels through their R&D spending and capital expenditures. One other observation is that prior to SB 302 (a California law effective January 2026), the state did not conform to IRC §6418 for tax purposes. Therefore, the discount on a purchased credit (e.g., buying a $100M credit for $90M) was potentially subject to state-level taxes for tax years before January 1, 2026.
Key Takeaway
Tax credit purchasing has spread to more than 30 states, demonstrating that this is not a regional phenomenon. While California's low purchase rate could be a regulatory outlier, the Golden State may close the gap with SB 302 now in effect.
For the next post that explores tax credit purchase rates by company sector and industry, click here. For the full series, start here.
Reunion maintains a database of public companies that have disclosed transferable tax credit purchases, available to entities buying or selling credits, and provides exclusive access to the underlying SEC data to existing buy-side and sell-side clients of Reunion. Reach out to your Reunion contact for access.
Data Notes
Analysis Period: February-March 2026
Universe: ~1,400 largest U.S. public companies
Filings Reviewed: 10-K, 10-Q, 20-F, 40-F filed since January 1, 2025
Methodology:
- Credit Classification: Many filings reference transferable credits without specifying type. These are classified as clean energy credits since transferability is generally tied to Section 6418.
- Sample Composition: Of approximately 1,400 companies, roughly 1,000 had filed both 2024 and 2025 reports during the analysis window. The remainder had not yet filed 2025 reports or had 2024 filings published before data collection began.
- Data Quality: An AI-assisted process was used to scan filings. All identified purchasing activity was then human-verified at the company level.