Why are electricians in Tennessee and Texas burning the midnight oil? Analyzing wage data across 119 clean energy projects in the U.S.
A data-driven look at what electricians are getting paid on real clean energy projects across 13 states

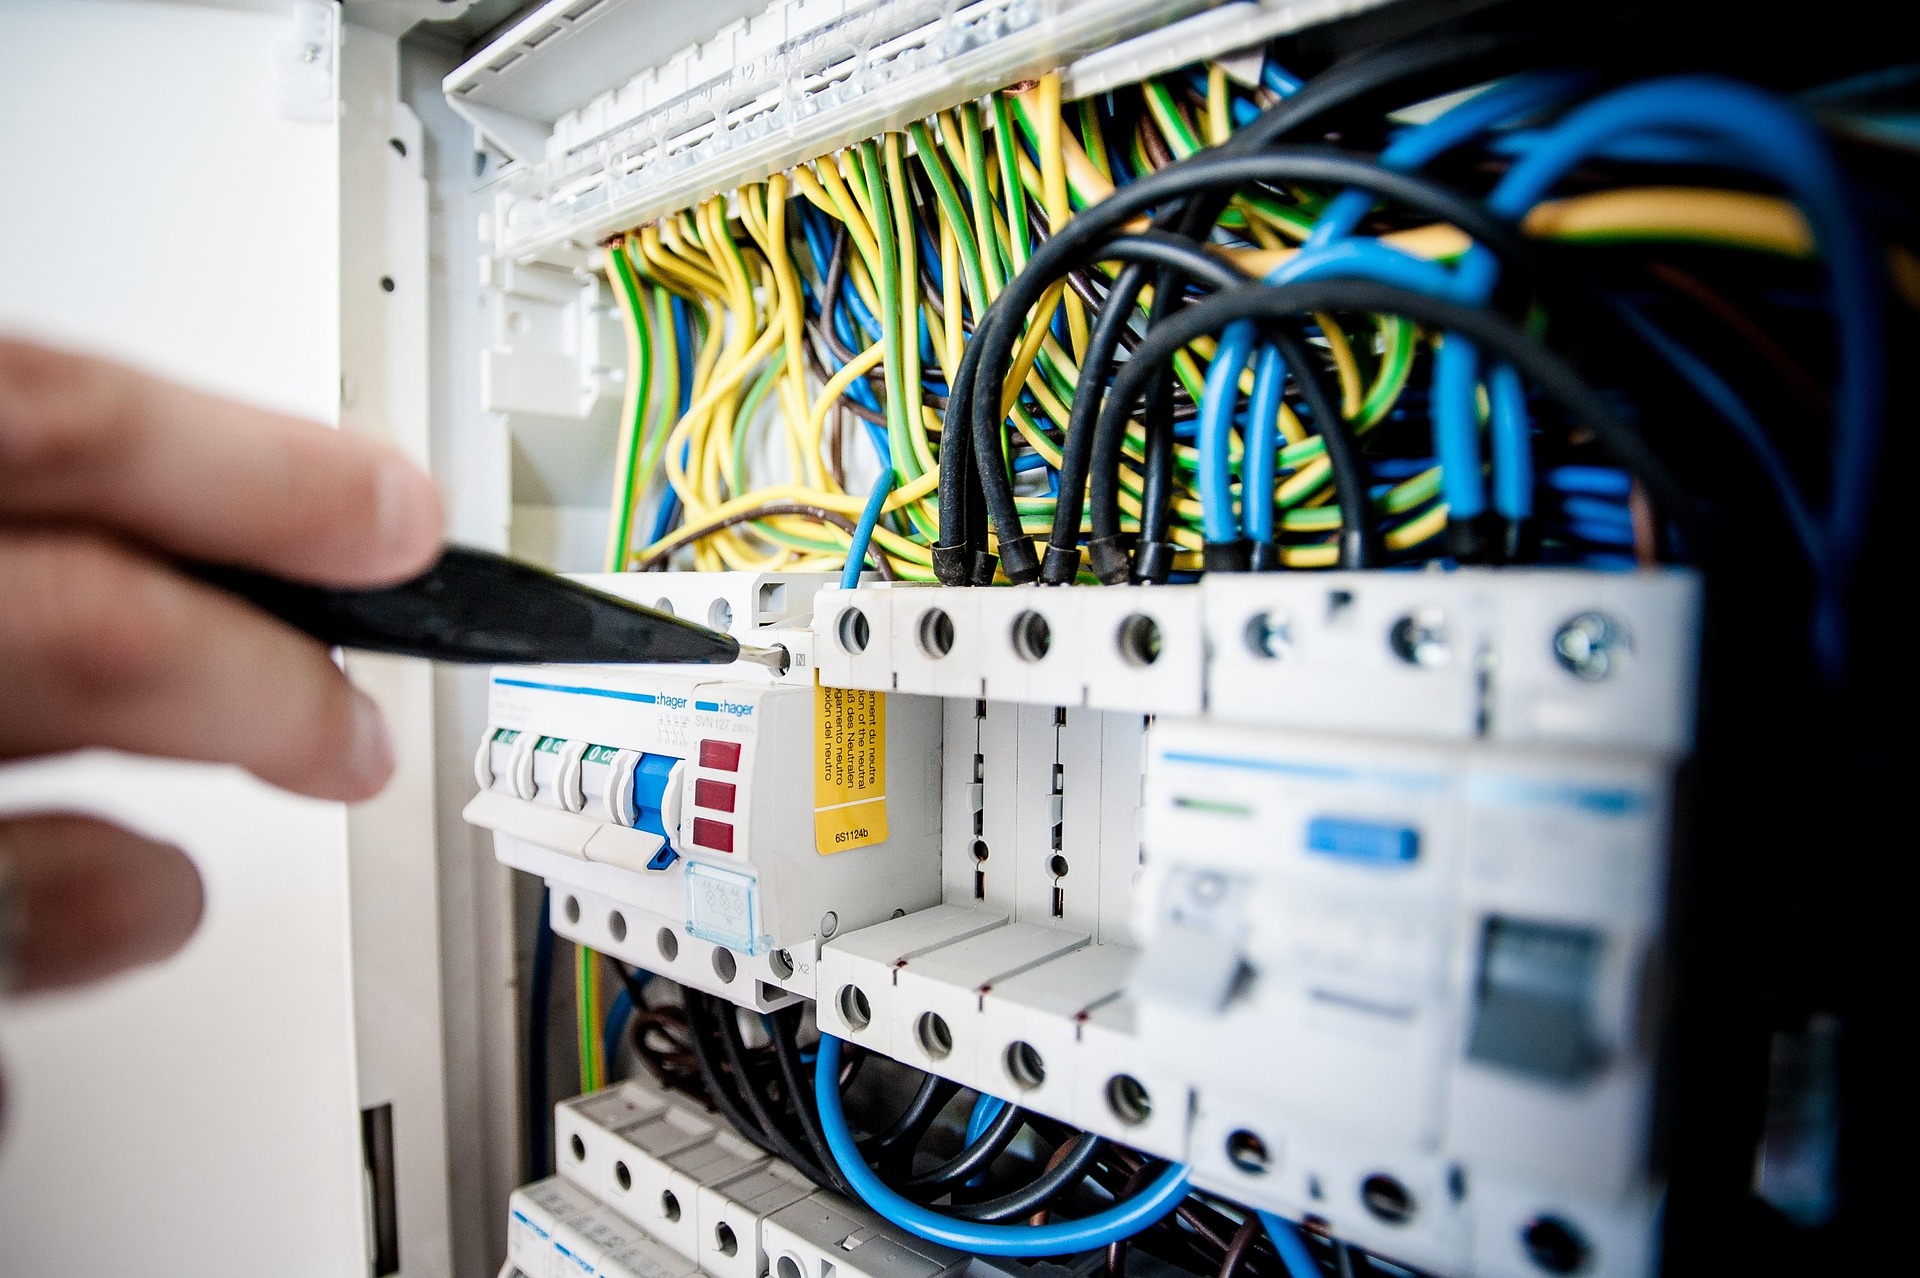
America’s electrical systems in 2026 are more vital than ever. They’re at the heart of the data centers, the AI revolution, electric vehicles, the widespread transition to carbon-free power, and more. As the demand for electricity rises, so too does the importance of the 820,000-plus electricians in the U.S. who know what all those wires mean and how to connect them.
The path forward looks similarly energized: the number of electricians in the U.S. is expected to grow 9 percent over the next decade, compared to an average of 3 percent across all occupations.
Reunion has a unique window into many of the projects that are keeping the nation’s electricians busy. Our Prevailing Wage and Apprenticeship compliance platform for clean energy developers has processed more than 83,000 worker-weeks of certified payroll across 168 projects in 27 states. Many of these projects – which include technologies like solar panels, battery storage, alternative fuels, and carbon capture – depend heavily on electricians to keep power flowing safely.
Energy project payroll data covers a variety of skilled tradespeople, such as pipe fitters, machine operators, and laborers. In this post, however, we drill down exclusively into electricians and their wages, given their rising prominence in an economy where “electrifying everything” and powering critical infrastructure are paramount.
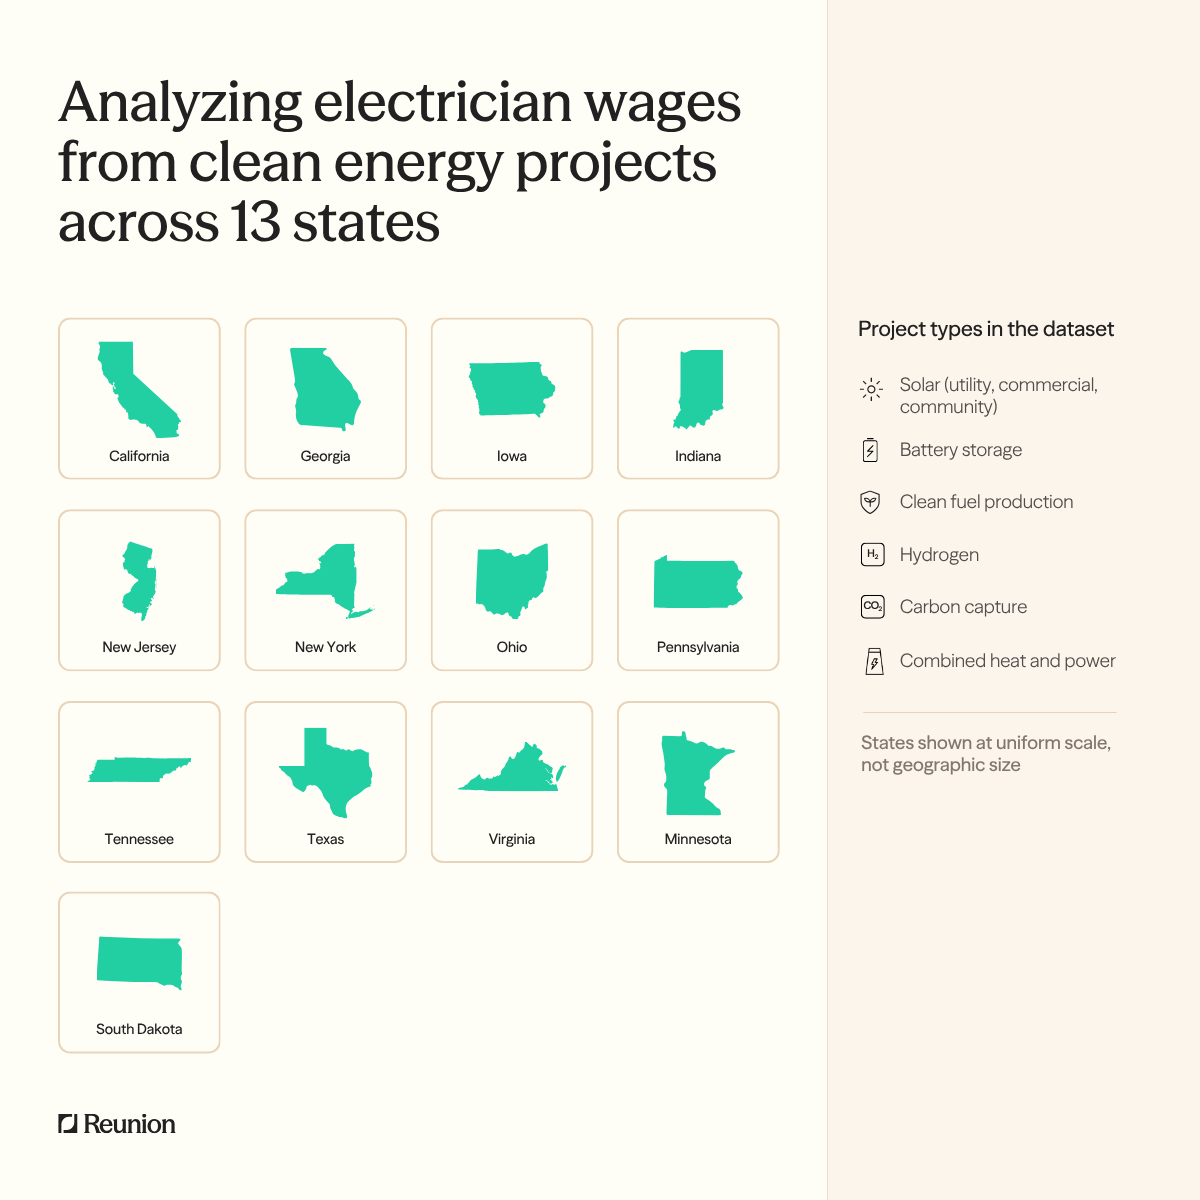
As detailed in our Methodology section, this post’s wage analysis covers actual pay for roughly 8,000 electrician worker-weeks between September 2024 and August 2026. Those worker-weeks map to more than 1,000 journeyworker electricians and apprentices across 119 projects in 13 states. Since clean energy projects can only qualify for certain enhanced tax incentives if workers are paid local prevailing wages, the electrician worker-weeks in our dataset all meet or exceed baseline wage rates.
Median electrician pay ranges from $26 to $109 an hour, depending on the state
Looking at total hourly compensation (cash plus fringe benefits) across the 13 states in our dataset, New Jersey electricians working on clean energy projects led the group with a median wage of $109 per hour, which includes a large fringe benefit component. That’s more than three times the hourly median wage in Virginia ($31), and more than four times the median rate in Texas ($26); the top 10% of New Jersey electricians earned about five times Texas’s median rate.
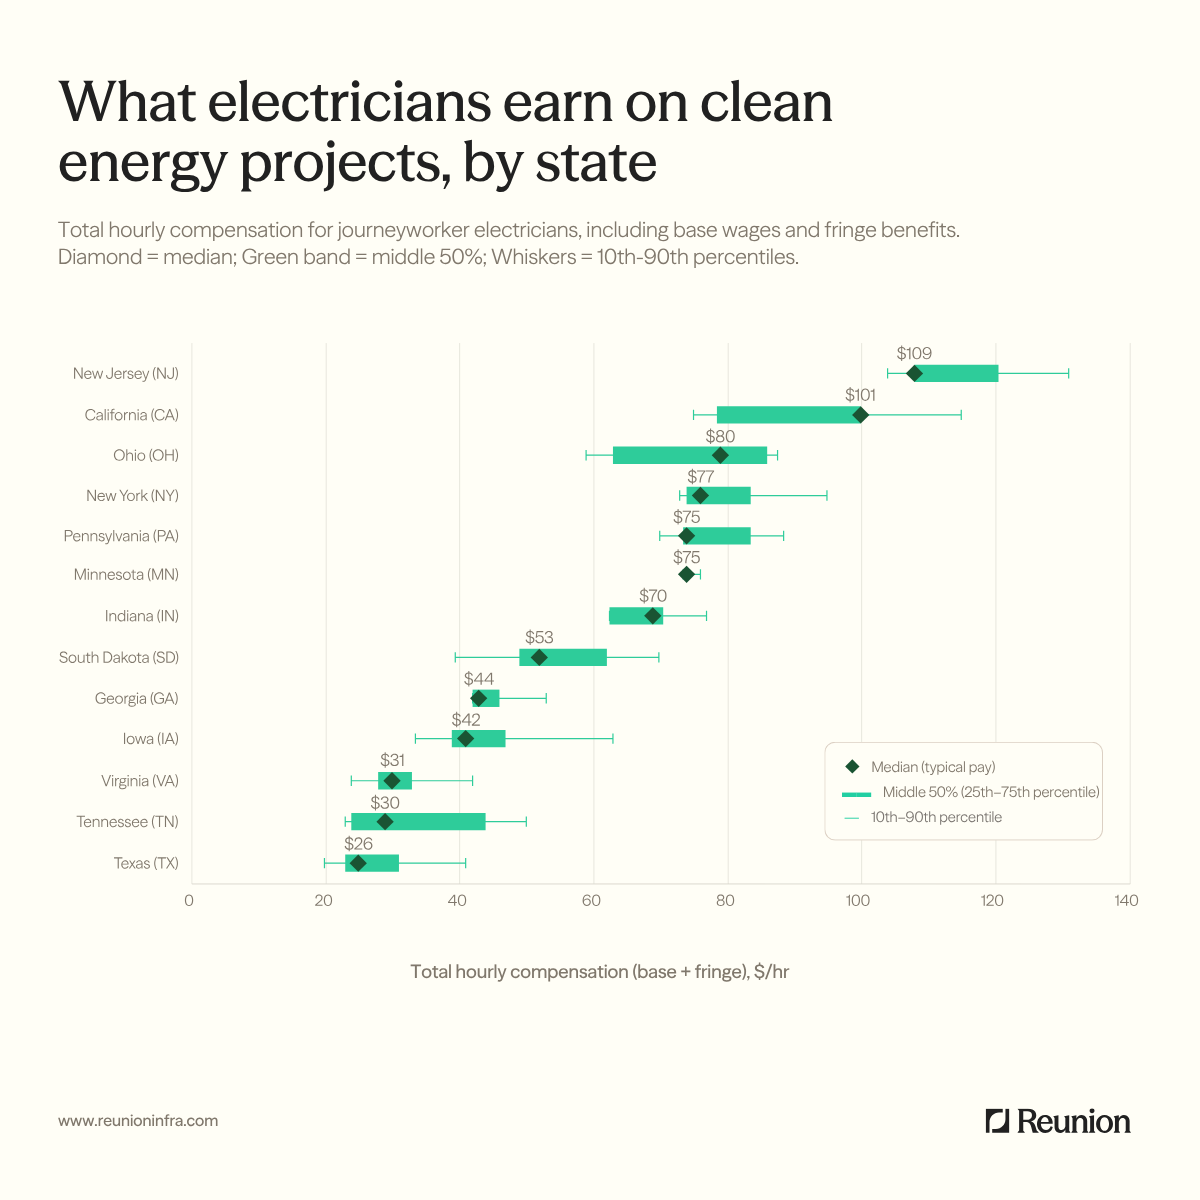
The median California electrician also cleared the $100 level, while the median electrician in Iowa, Georgia, and Tennessee joined their counterparts in Virginia and Texas in making below $50 per hour.
In most states, pay levels exhibited a substantial spread outward from the median. In South Dakota, for instance, where the median was $53 per hour, workers at the 10th percentile earned closer to $40, while those at the 90th percentile made around $70.
Fringe benefits often represent a major share of electricians’ total compensation
In the majority of the states considered, compensation is heavy on fringe benefits – which can take the form of add-ons like health insurance, pension contributions, vacation pay, and training funds.
Fringe benefits represented more than a third of compensation for the median clean energy electrician in New Jersey (48%), New York (42%), California (36%), Pennsylvania (36%), Indiana (35%), and Ohio (34%).
The frequent appearance of these fringe benefits is by design, and in fact shows how energy developers are meeting statutory requirements. The Inflation Reduction Act of 2022 introduced a sizable incentive (a five-times tax credit multiplier) for meeting Prevailing Wage and Apprenticeship requirements on clean energy projects. On the wage side, that means paying laborers or mechanics prevailing wages that meet or exceed rates set by the Department of Labor for a given locality, construction type, and trade.
The total prevailing wage has two components: the base hourly wages (light green bars below) and hourly fringe benefits (dark green bars below); the overall requirement can be met using any additive combination of the two components. For example, in the chart below, we see that the median electrician in Indiana received $45 in cash and $24 in fringe benefits. In most states, this hourly pay package cleared the prevailing wage requirement (yellow hashmark) with room to spare, though in Minnesota the typical electrician was paid exactly at the required rate.
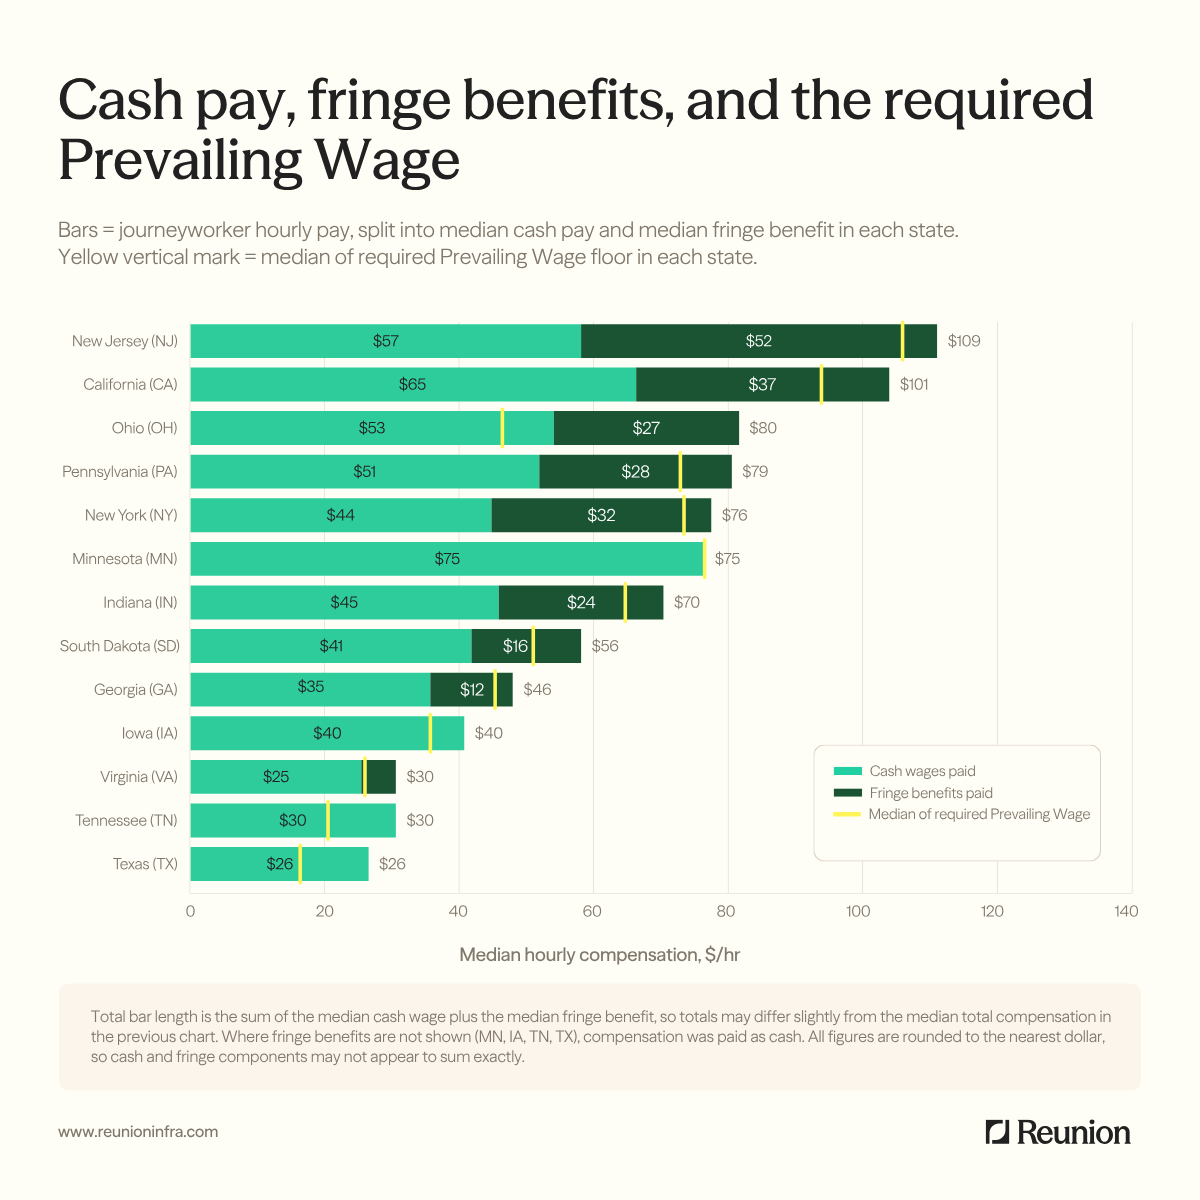
Project owners are assessed for prevailing wage compliance based on the total required sum of cash and fringe benefits. For example, it is acceptable to pay extra cash wages instead of fringe benefits, provided that the extra wages are equivalent in value to the required fringe. This explains the handful of “cash only” states in our dataset (Minnesota, Iowa, Tennessee, and Texas) that are missing the fringe component.
Within states, electrician pay varies widely from county to county
The Department of Labor sets prevailing wages county by county, not state by state, so a single state can contain several different pay regimes. Our dataset covers more than 50 counties across 13 states. The spread in hourly electrician pay within those states can be as striking as the spread across them.
Iowa shows the pattern clearly. Ten of its counties appear in our data, and the median total compensation ranges from about $66 per hour in the highest-wage county, down to roughly $34 in the lowest. This high-wage county is one where union agreements primarily shaped prevailing wages; most of the lower-paying counties reflected survey-based or custom rates instead.
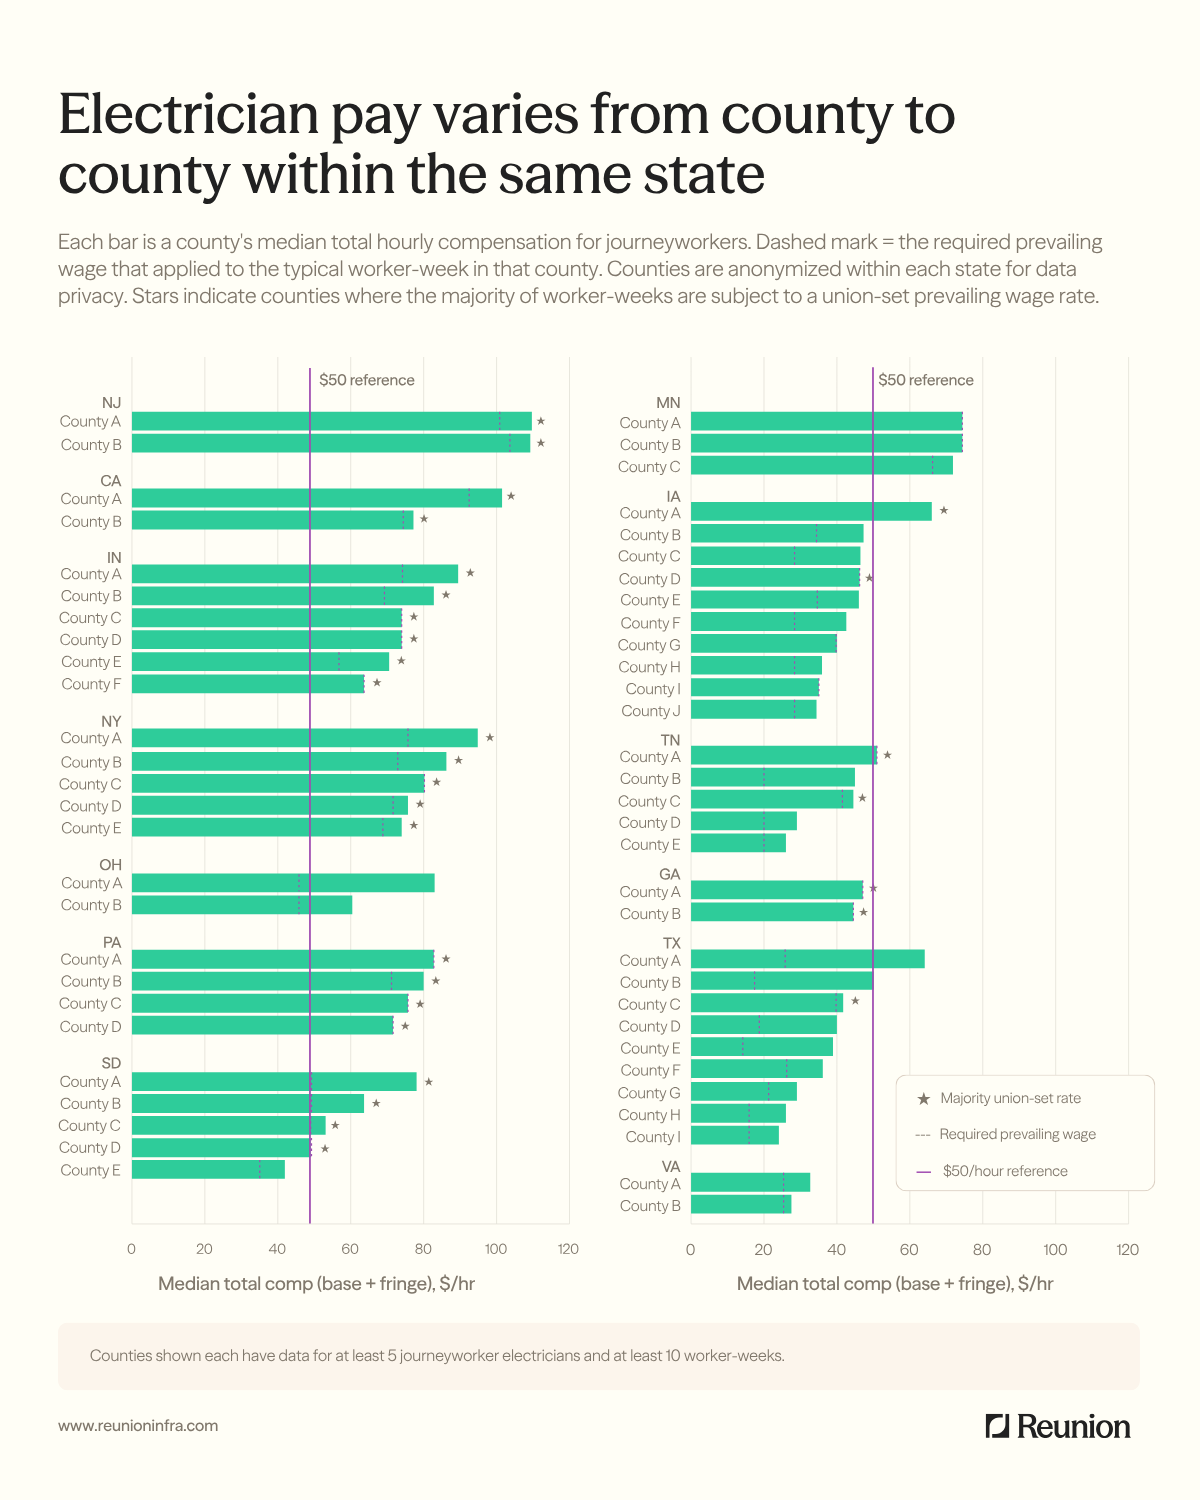
Other states have comparable ranges: South Dakota from $78 to $42 per hour, Indiana from $89 to $63, and Tennessee from $51 to $26.
In a few states, the variation is much narrower. New Jersey's two counties in our dataset differ by just 55 cents an hour, and Minnesota's three counties sit within $2.50 of each other. This convergence is likely related to similar prevailing-wage determinations.
Project type may be a factor as well. One of the largest premiums over the local prevailing wage anywhere in our dataset – about $37 extra per hour – showed up in an Ohio county where electricians were working on a more novel and specialized technology than solar photovoltaic and battery energy storage systems.
California apprentices out-earn nearly all Texas journeyworkers
One path to becoming a journeyworker electrician is completing a multi-year registered apprenticeship program, which consists of paid on-the-job training alongside classroom instruction. Apprentice pay usually rises in steps: experienced apprentices are paid more than their counterparts who are just starting out.
Apprentices showed up in 12 of our 13 states, though only eight states had a sufficient volume of apprentice payroll data to analyze reliably (see Methodology). California apprentices were among the highest paid: their hourly wage rate (cash+fringe) spanned $46 to $89, with a median of $60. That’s more than the median journeyworker earned in Texas ($26), Tennessee ($30), or South Dakota ($53).
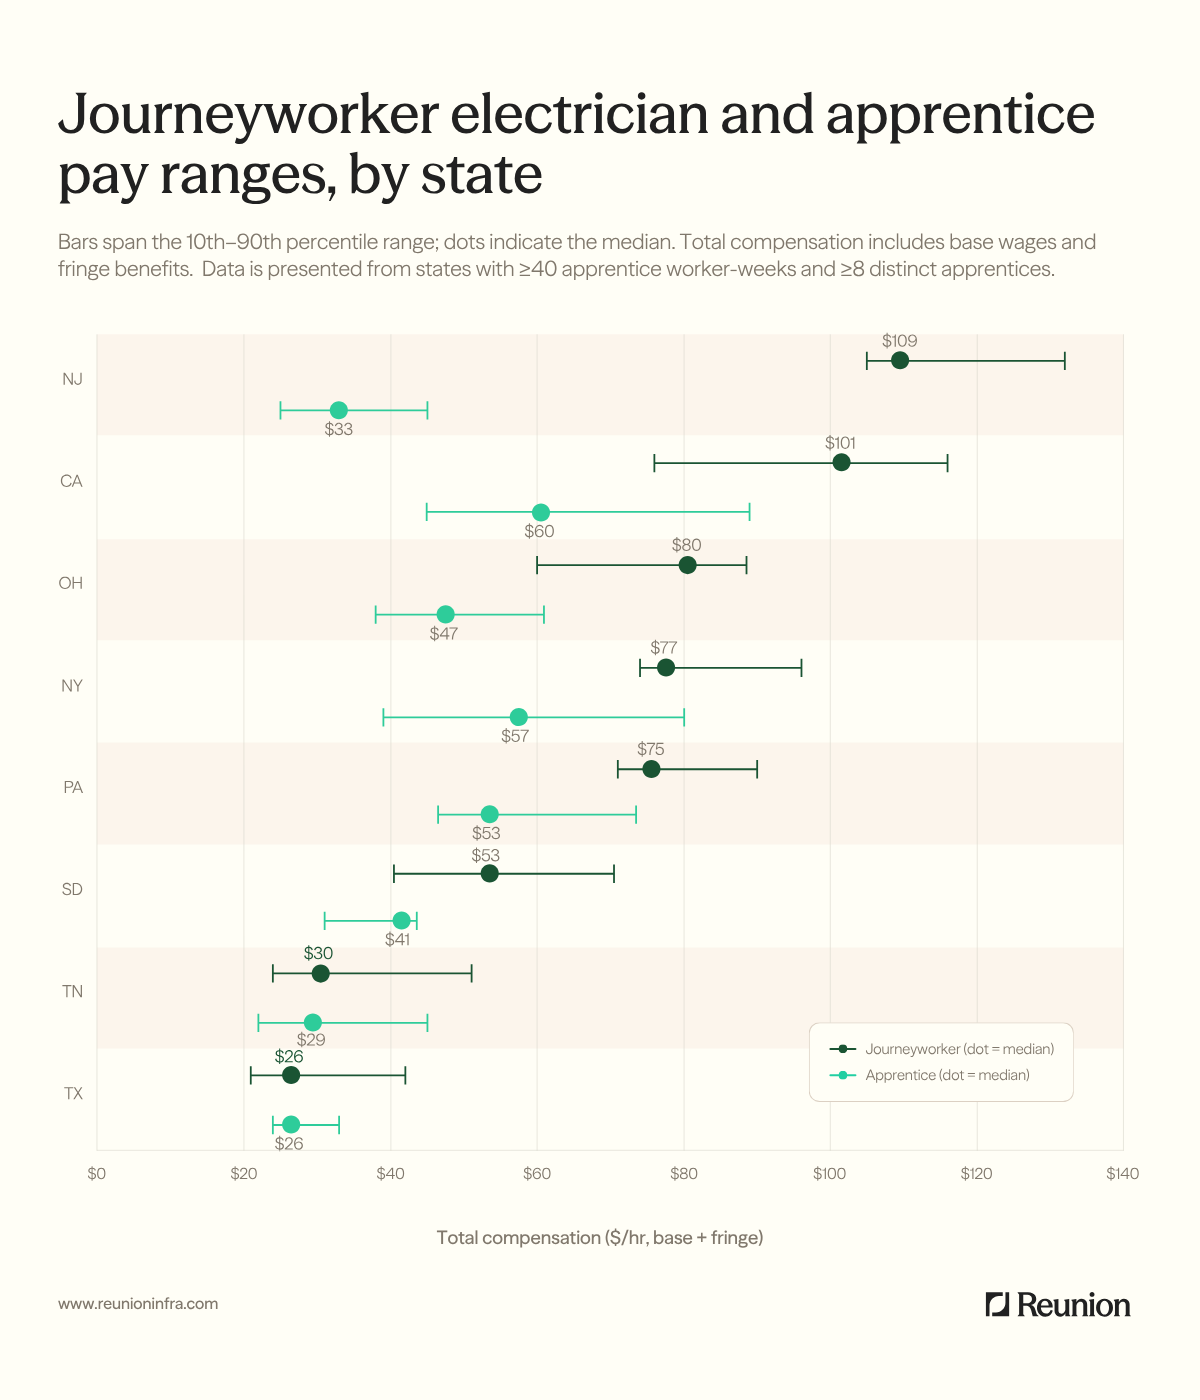
We found the relative gap between median wages for apprentices and journeyworkers to be widest where journeyworkers are highest paid to begin with. The median New Jersey journeyworker earned 3.4 times the typical apprentice there. This gap partly reflects where New Jersey's apprentices sat in their programs: three-quarters of the state’s apprentice worker-weeks in our dataset came from early periods of their apprenticeship, at $25-36 hourly. Garden State electrical apprentices at the top levels of the same programs earned closer to $45 per hour.
Most other states in our dataset saw median journeyworkers making 30-70% higher wages than the median apprentice in their respective state, including in Ohio (a 70% premium), California (69%), Pennsylvania (43%), New York (35%), and South Dakota (31%).
In Texas and Tennessee, the highest-paid journeyworkers make more than the best paid apprentices, but the medians nearly touch. These were the two lowest-paying states for journeyworkers in our dataset, leaving less room for a sizable gap between experienced electricians and trainees.
Clean energy electricians in lower-wage states like Tennessee and Texas are burning the midnight oil
Our payroll data reveals that electricians in lower-wage states are making up for lower hourly pay by working more hours, sometimes to a remarkable degree.
In Tennessee and Texas, where we observed median wages of $30 and $26 respectively, journeyworker electricians made around one-third of their total compensation through working overtime or double-time hours. (Tennessee apprentices leaned on premium hours even harder, drawing 47% of their pay from overtime and double time.)
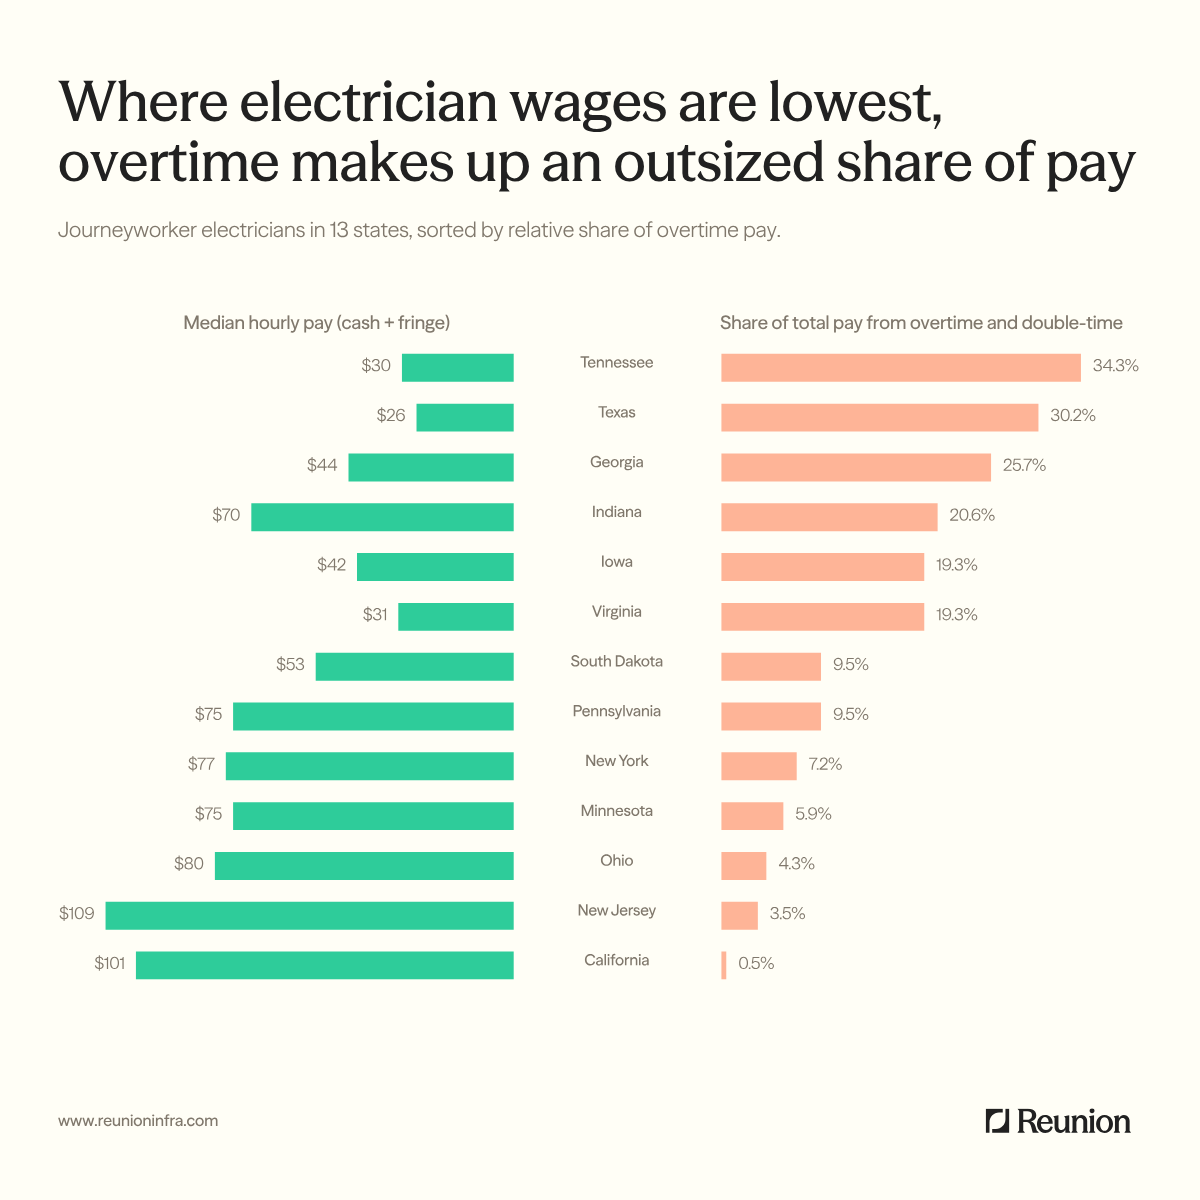
On the other end of the spectrum – in higher-paying states like New Jersey, California, and Ohio – overtime hours were minimal and represented less than 5% of overall electrician pay.
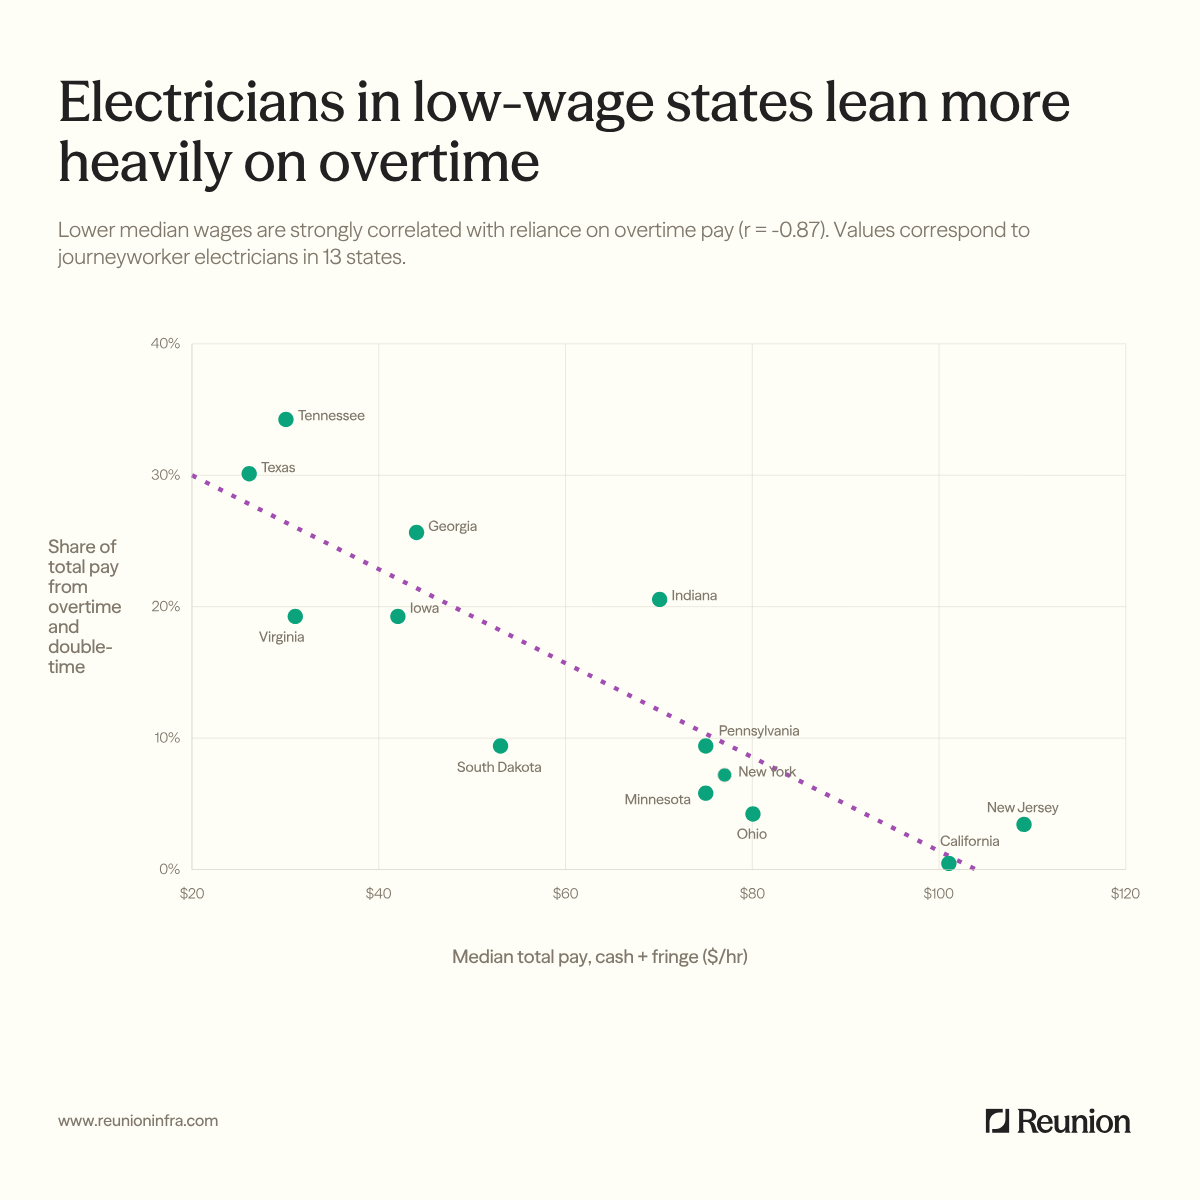
A scatterplot tying together median wages and overtime intensity in each state produces a clear statistical relationship: the lower a state’s electrician wages, the greater the reliance on overtime hours (r = -0.87 across 13 states).
Accounting for the lower cost of living in low-wage states does not change the bottom of the ranking. If we look at electricians who worked 40 or more hours in a week (including overtime and double-time) but recalibrate weekly pay to reflect the cost of living in each state, Tennessee and Texas still rank tenth and eleventh out of the twelve states with enough full-week data. The adjustment does reshuffle the top: Indiana and Ohio, where costs run roughly 10% below the national average, move ahead of New Jersey and California. But both of those coastal states remain in the top half of the weekly pay ranking.
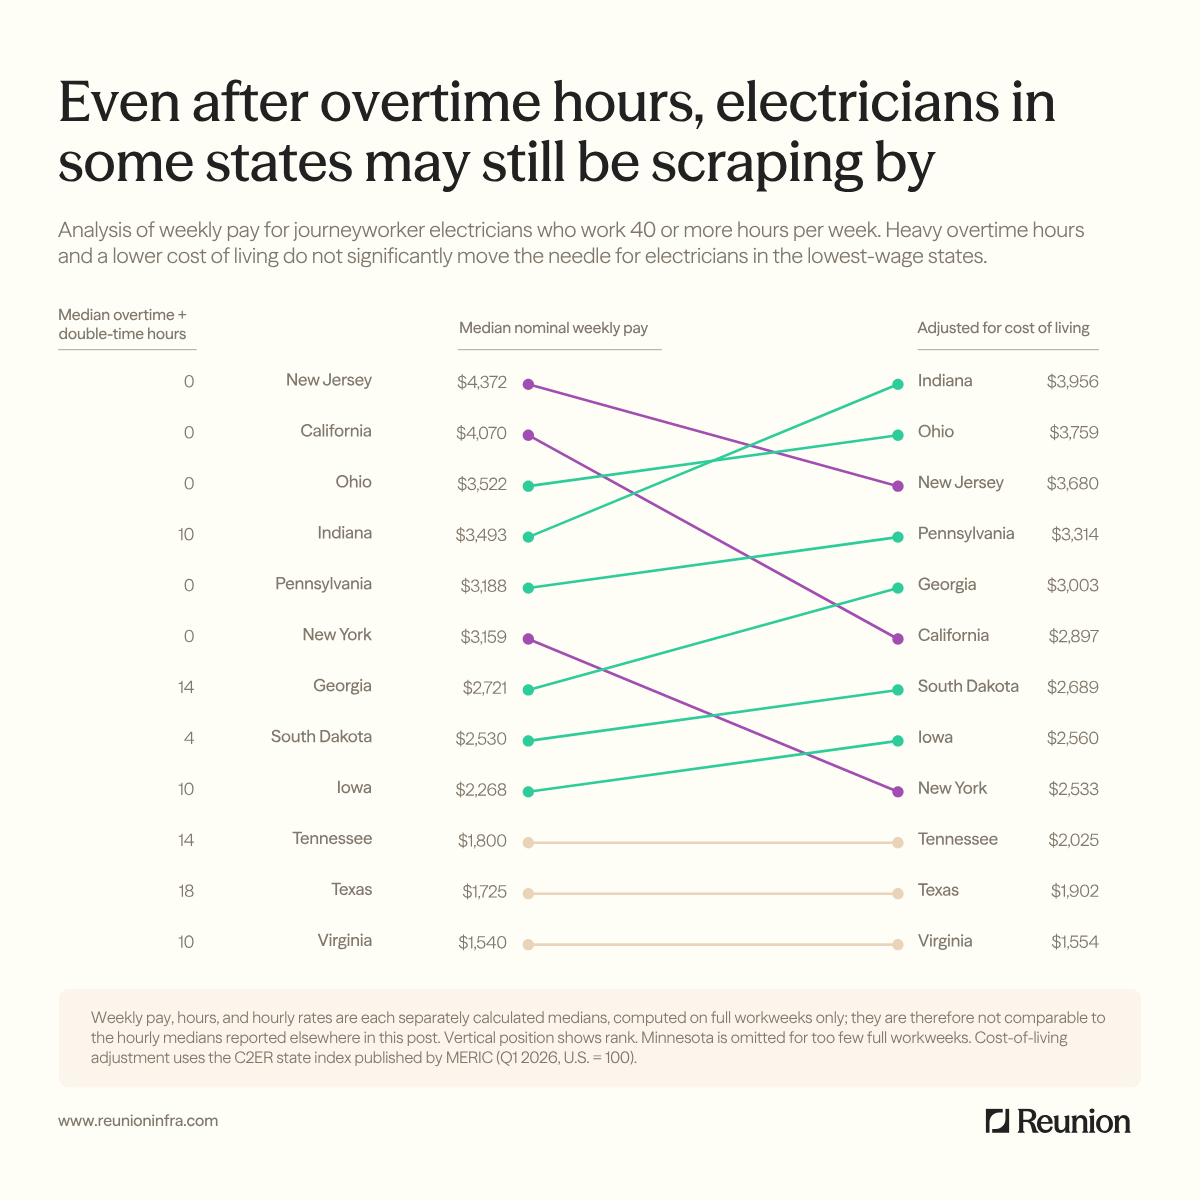
We can’t say for certain why the heavy overtime pattern holds. It could be workers seeking extra hours, contractors extending their existing crews, or other differences in workplace practices or cultures. What we can say with confidence: Tennessee and Texas electricians are sweating it out to bring more clean energy online.
—---
Methodology
Scope: This analysis covers 7,899 electrician worker-weeks across 119 projects and 13 states, representing 1,070 individual electricians, some of whom appear as both apprentices and journeyworkers as they progressed through their programs. Of those worker-weeks, 6,736 were journeyworker and 1,163 apprentices. As of August 18, 2026, the broader platform dataset from which this is drawn contains 83,835 worker-weeks across all trades, covering 168 clean energy projects in 27 states.
Unit of Analysis: Our unit of analysis throughout is the worker-week: one electrician's recorded pay on one project for one week of certified payroll. When we report a median wage, we mean the median across worker-weeks, not across individual workers, so an electrician who appears on a project for twenty weeks contributes twenty observations. We use medians rather than averages throughout, since a handful of unusually high or low rates would otherwise skew state-level figures.
Compliance and hours: We restricted the analysis to payroll rows marked compliant with Prevailing Wage and Apprenticeship requirements (PWA), and only counted wage rates where hours were actually worked and earned (straight-time hours greater than zero).
Sample thresholds: A state appears in our analysis only if it included data for at least 20 electricians, at least 80 worker-weeks, and at least 2 distinct projects. A single sponsor may account for multiple projects in a state. For the apprentice analysis, we additionally required at least 40 apprentice worker-weeks and 8 distinct apprentices, which is why that section covers eight states rather than thirteen. For county-level figures, we required at least 5 electricians and 10 worker-weeks per county, and we anonymized county names.
Outliers: We removed worker-weeks showing a standard wage below $8 or above $200 per hour, and those showing fringe benefits above $120 per hour (60% of our $200 wage ceiling).
Overtime pay: Overtime and double-time compensation is calculated from the actual premium rates recorded on each certified payroll row, not from assumed multipliers of 1.5x and 2x base pay.
Required prevailing wages: The required rate for each worker-week combines the base wage and the fringe requirement, including both the flat and percentage components of fringe where applicable.
Fringe Benefits: The term "fringe benefits" throughout this post refers to bona fide fringe benefits. Under the Davis-Bacon regulations at 29 CFR Part 5, a fringe benefit contribution counts toward total compensation for prevailing wage purposes only if it is made to a bona fide plan, fund, or program.
Data currency: Analytical results reflect payroll data processed as of August 18, 2026, covering work performed between September 2024 and August 2026.
Cost of living: For the cost-of-living comparison, we restricted the sample to full work weeks, meaning worker-weeks with 40 or more total hours. Minnesota is excluded from that comparison because it had a limited number of full weeks, which is why the section covers twelve states rather than thirteen. We divided median full-week pay by each state's cost-of-living index from the Council for Community and Economic Research survey, as published by the Missouri Economic Research and Information Center (first quarter 2026, U.S. = 100). That index averages participating cities and metropolitan areas, so we use it for relative ranking rather than as a precise measure of purchasing power.

